Chapter 3: Core Web Vitals Audit Workflow
With Google adding page experience signals as ranking factors, monitoring, auditing, and improving Core Web Vitals becomes critical for SEOs.
When auditing CWV, SEOs can follow different workflows and methodologies and achieve the same results. However, based on Google’s suggested workflow, we recommend a five-phase methodology to audit Core Web Vitals.
Phase 1. Instrumentation
As discussed earlier, Google uses Field Data or Real User Metrics (RUM) when evaluating Core Web Vitals on a website. Therefore, installing monitoring tools that collect Field Data should be the first step in the audit process.
Google offers free tools that will allow you to collect limited Field Data for your site.
- CrUX Dashboard to monitor the overall performance of your site.
- Google Search Console to identify groups of pages that need attention.
- JavaScript library to compute Core Web Vitals and send the values to your analytics tool.
These tools should be enough to collect and monitor CWV data for your site. However, we recommend taking it one step further and installing RUM monitoring tools that support Core Web Vitals.
Here are some RUM tools that collect CWV data:
- Atatus
- Catchpoint
- Request Metrics
- Speed Curve
- mPulse
- Treo
- Dynatrace
- Sentry
- RapidSpike
- Raygun
- Datadog
- CWV-Insights
In any case, when installing any RUM tool to monitor Core Web Vitals, make sure that measurement won’t affect performance. You don’t want a solution that can become part of the problem!
Phase 2. Identify pain points
Once there is at least 28 days of Field Data, you can start using Google’s tools to evaluate website performance and identify pain points.
As you assess the data, you will need to answer three critical questions:
- How is the site performing overall? Does it need attention?
- What Core Web Vitals should you prioritize?
- What group of pages are most negatively affected?
CrUX Dashboard
To get a snapshot of how the site is doing, use the CrUX Dashboard, which provides information on:
- Core Web Vitals overview for your site, split by device.
- Standalone performance for each metric, split by device.
- User demographics, split by device and effective connection types (ETCs).
The CrUX Dashboard aims to get insights into the overall website performance and understand how website changes have impacted Core Web Vitals over time. Read Google’s guide to the CrUX Dashboard to know more details about using this data.
Google Search Console
Google released a Core Web Vitals report in Google Search Console, which shows how the pages perform based on Field Data.
This report breaks down the data by Mobile and Desktop and presents URL performance grouped by status, metric type, and URL group.
The status represents the thresholds of each Core Web Vital: Poor, Needs Improvement, or Good. Only green URLs are passing the Core Web Vitals assessment.
The URL group includes pages that Google considers to provide a similar user experience. Although you might find the performance data of a single URL in a URL group, you should use PageSpeed Insights or Lighthouse tools to run a test on a single URL.
It’s important to note that only indexed URLs can appear in this report. However, Google has hinted that they might use Core Web Vitals data from noindex pages too.
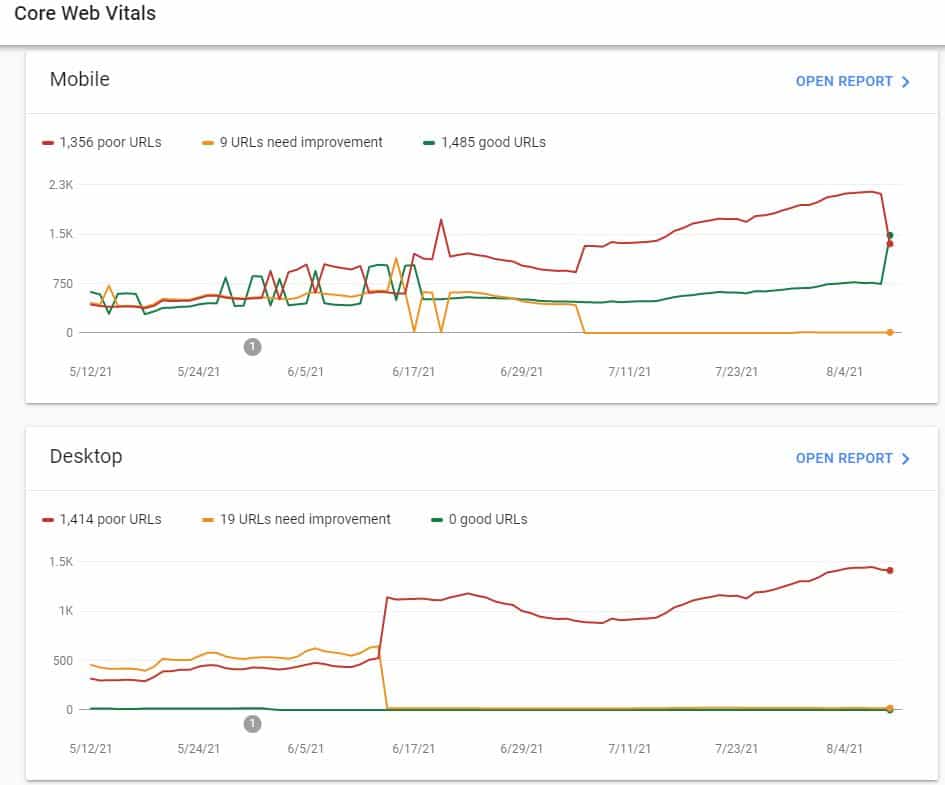
Keep in mind that new Google Search Console properties may need a few days to report on Core Web Vitals. Properties with a low volume of traffic may not see Core Web Vitals data at all.
The Core Web Vitals report also allows you to validate your fixes to CWV issues. However, it will take up to 28 days for Google to report whether the problems were fixed. That’s because, as mentioned earlier, the Core Web Vitals report is based on Field Data, which includes the last 28-days of data. In Phase 4, we explain what to expect in Field Data tools after implementing improvements.
Reviewing CWV in Google Search Console is critical since it shows groups of pages that require attention. Once you identify the pages that need work, you can use other tools for auditing lab and field issues on a page.
RUM tools can also provide similar information, although Google Search Console tells you exactly how Google is evaluating your pages.
Selecting page groups
Your next step is to create an inventory of pages to test and debug in the upcoming phases. You must identify the major page types and templates affected and record the scores using Google Search Console data.
The most common flight page templates are:
Destinations (or Homepage)
- Flights from City to City
- Flights to City
- Flights from City
- Flights from Country to Country
- Flights from City to Country
- Flights to Country
- Flights from Country
Gather a sample of the most visited pages within each page template and find performance pitfalls.
Phase 3. Uncover optimization opportunities
With the insights from the previous phase, it’s time to get into the performance details of the affected groups of pages. To do this, you will need to rely mainly on Lab Data.
Lab Data provides clues on how potential users will likely experience your pages. This data is critical for debugging and getting actionable guidance to uncover and fix performance issues.
The most important questions to answer during this phase are:
- How can each Core Web Vital be optimized?
- What are the low-hanging fruits to tackle immediately?
- What improvements require more planning?
Google offers three free tools that you can use to collect Lab Data and answer your burning questions.
PageSpeed Insights
PageSpeed Insights displays both Lab Data and Field Data for a single URL, provided that the page has more than 28 days of CrUX data.
Start by analyzing the performance details of a URL that is part of a group of pages you want to prioritize. Besides telling you whether your page passes each Core Web Vital (something you should know already at this point!), PageSpeed Insights provides an extensive Audit section.
The Audit section splits into three subsections:
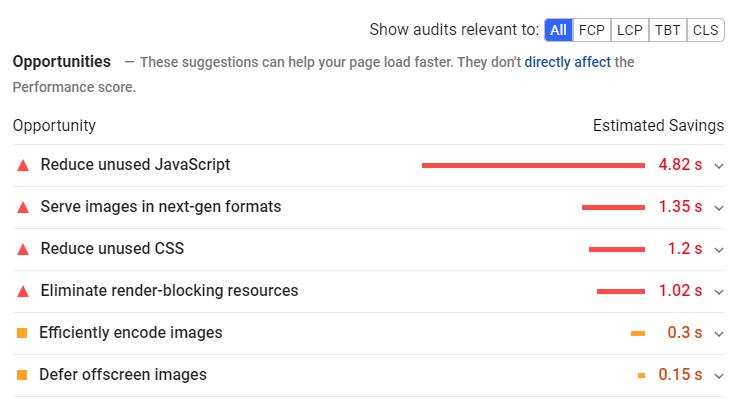
Opportunities reveals suggestions to improve the page’s performance metrics, including Core Web Vitals.
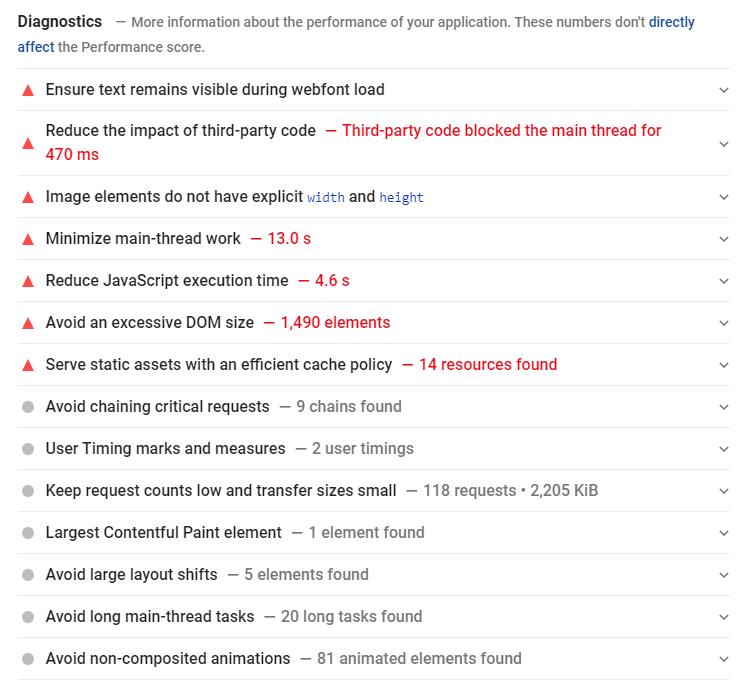
Diagnostics offers additional recommendations to follow best practices for web development, although they won’t necessarily improve the page’s performance metrics.
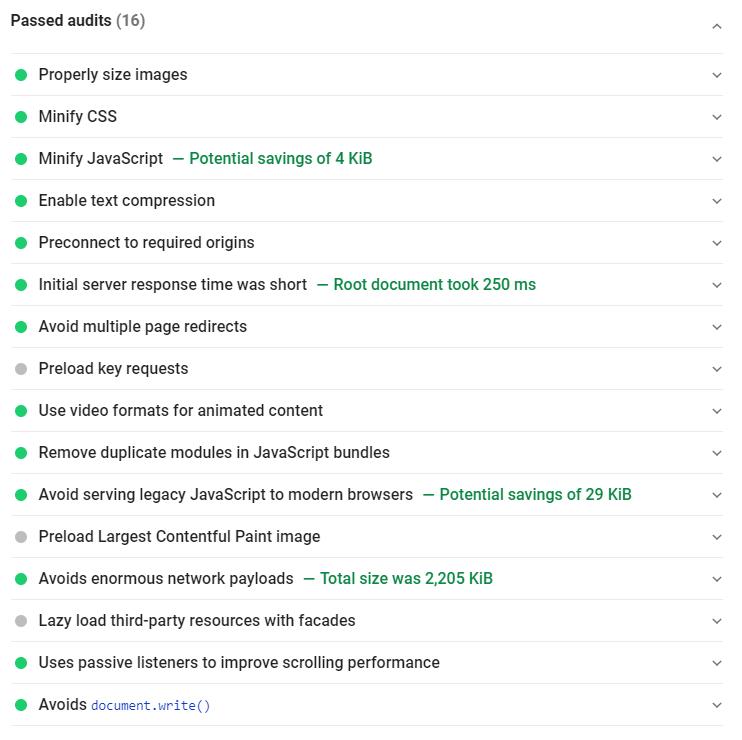
Passed Audits indicates the audits that the page has passed.
Although the recommendations in the Audit section shouldn’t vary from run to run, the Performance Score can. That’s because variability in performance measurement is expected. Common sources of variability are local network availability, client hardware availability, and client resource contention.
Lighthouse
Lighthouse is another Google’s website auditing tool. Like Google PageSpeed Insights, Lighthouse reports on CWV Lab Data and provides a series of recommendations to improve a page’s performance metrics.
However, Lighthouse audits go beyond Core Web Vitals and include other dimensions of user experience quality such as Accessibility and Best Practices.
You can access Lighthouse through Chrome DevTools or by installing the Chrome extension. Follow best practices to run a Lighthouse test:
- Open Chrome in Incognito Mode.
- Go to the Network panel of Chrome Dev Tools.
- Tick the box to disable cache.
- Navigate to the Lighthouse panel.
- Select Device.
- Click Generate Report.
- Save the file.
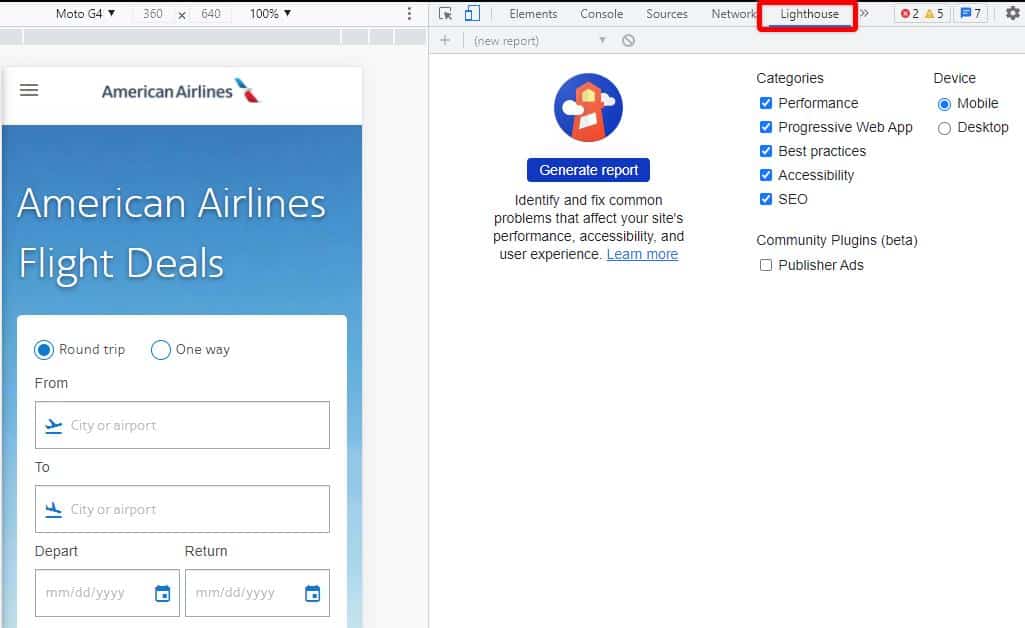
Alternatively, you can run a Lighthouse report from https://web.dev/measure/ and save some steps.
An important consideration is that Lighthouse features only two Core Web Vitals (LCP and CLS). That’s because Lighthouse cannot compute FID, which is based on users’ input. Instead, Lighthouse measures Total Blocking Time (TBT), which is a proxy metric for FID.
Finally, keep in mind that Lighthouse emulates a slow 4G connection on a mid-tier Android device, and that’s ok. In the end, you want to know your site performs in these harsher conditions, which are not uncommon for an airline’s international audience.
For more on using Lighthouse to audit CWV, read Google’s Optimizing Web Vitals with Lighthouse.
Discrepancies between PageSpeed Insights and Lighthouse
Although Lighthouse powers the Performance Score in PageSpeed Insights, you may get slightly different Lab Data results between them. That’s mainly because:
- Lighthouse uses your physical location, while PageSpeed Insights uses a different location.
- Lighthouse uses a throttled network, while PageSpeed Insights does not use throttling.
- Each tool uses a different CUP.
- The Chrome version you use to run a Lighthouse may be different than that used by PageSpeed Insights.
- PageSpeed Insights may be using a different Lighthouse version.
- You may have Chrome extensions affecting the Lighthouse scores for your page.
Minor discrepancies are typical and expected. Don’t obsess over it. Instead, your job is to find patterns and major issues to prioritize, and both tools will give you that.
Chrome DevTools
Chrome DevTools is quite a powerful tool to measure and debug performance. You can get a deep dive into all the great features of Chrome DevTools on Google’s documentation.
For CWV purposes, you will want to focus primarily on a few features:
- The Performance tab to analyze the waterfall and the CWV lane.
- The Experience section in the Chrome DevTools Performance panel to identify unexpected layout shifts.
- The Coverage tab to find unused JavaScript and CSS code.
- Enabling Local Overrides to make code changes on a live page and perform follow-up audits after the changes.
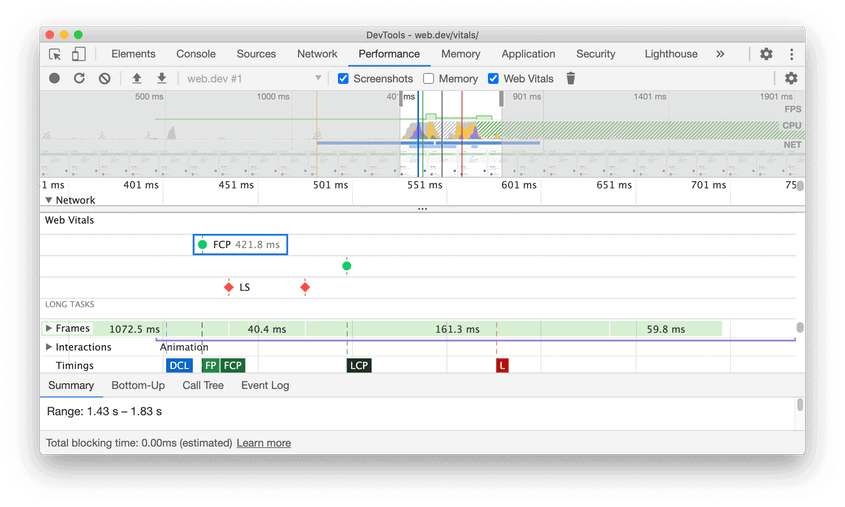
The following sections will cover how to use these tools (and more) to troubleshoot and optimize CWV.
WebPageTest
Another tool that you will use a lot to debug CWV in the field is WebPageTest. WebPageTest is packed with valuable features, reports, and experimentation tools to analyze CWV.
Run your affected URL in WebPageTest to get a summary of the CWV for your page.

You can click on each Core Web Vital to display a dedicated report. For example, here is the CLS report that highlights the layout shifts occurring on the page:

These reports are basic, but WebPageTest offers power tools to do a deep dive into each CWV. They include a variety of testing locations, browsers, connections, and devices. You can also dig into waterfalls, filmstrips, comparison videos, inject scripts, block resources, create experiments, and much more.
Here are a few resources to get started on using WebPageTest to analyze CWV:
- Analyzing Web Vitals with WebPageTest
- How to run a WebPageTest test
- How to read a WebPageTest Waterfall View chart
- How to use WebPageTest’s Graph Page Data
- WebPageTest comparison URL generator
In later sections, we will use WebPageTest many times to find optimization opportunities for each Core Web Vitals.
Phase 4. Implement and wait
Once you have implemented the improvements, you need to ensure that the changes positively impact page experience. For that, you need Field Data!
It takes 28 days for the CrUX data to be aggregated, and Google uses the 75th percentile of that data to determine the value of each CWV. Therefore, do not expect the improvements to be immediately noticeable after implementation.
To understand the delay in reporting that this computation method brings, let’s take a great example explained by Smashing Magazine. Suppose that all your visitors got an LCP of 10 seconds for the last month, but you implemented improvements, and it now takes 1 second. Let’s also assume that you have the same number of visitors.
In that case, you would get the following results over the next 28 days:
Source: Adapted from Smashing Magazine.
As you probably noticed, you won’t see improvements until day 22, when, all of a sudden, LCP jumped to 1 second. This also affects reporting graphs, which is why you shouldn’t expect gradual improvements, but sharp switches between the CWV thresholds:
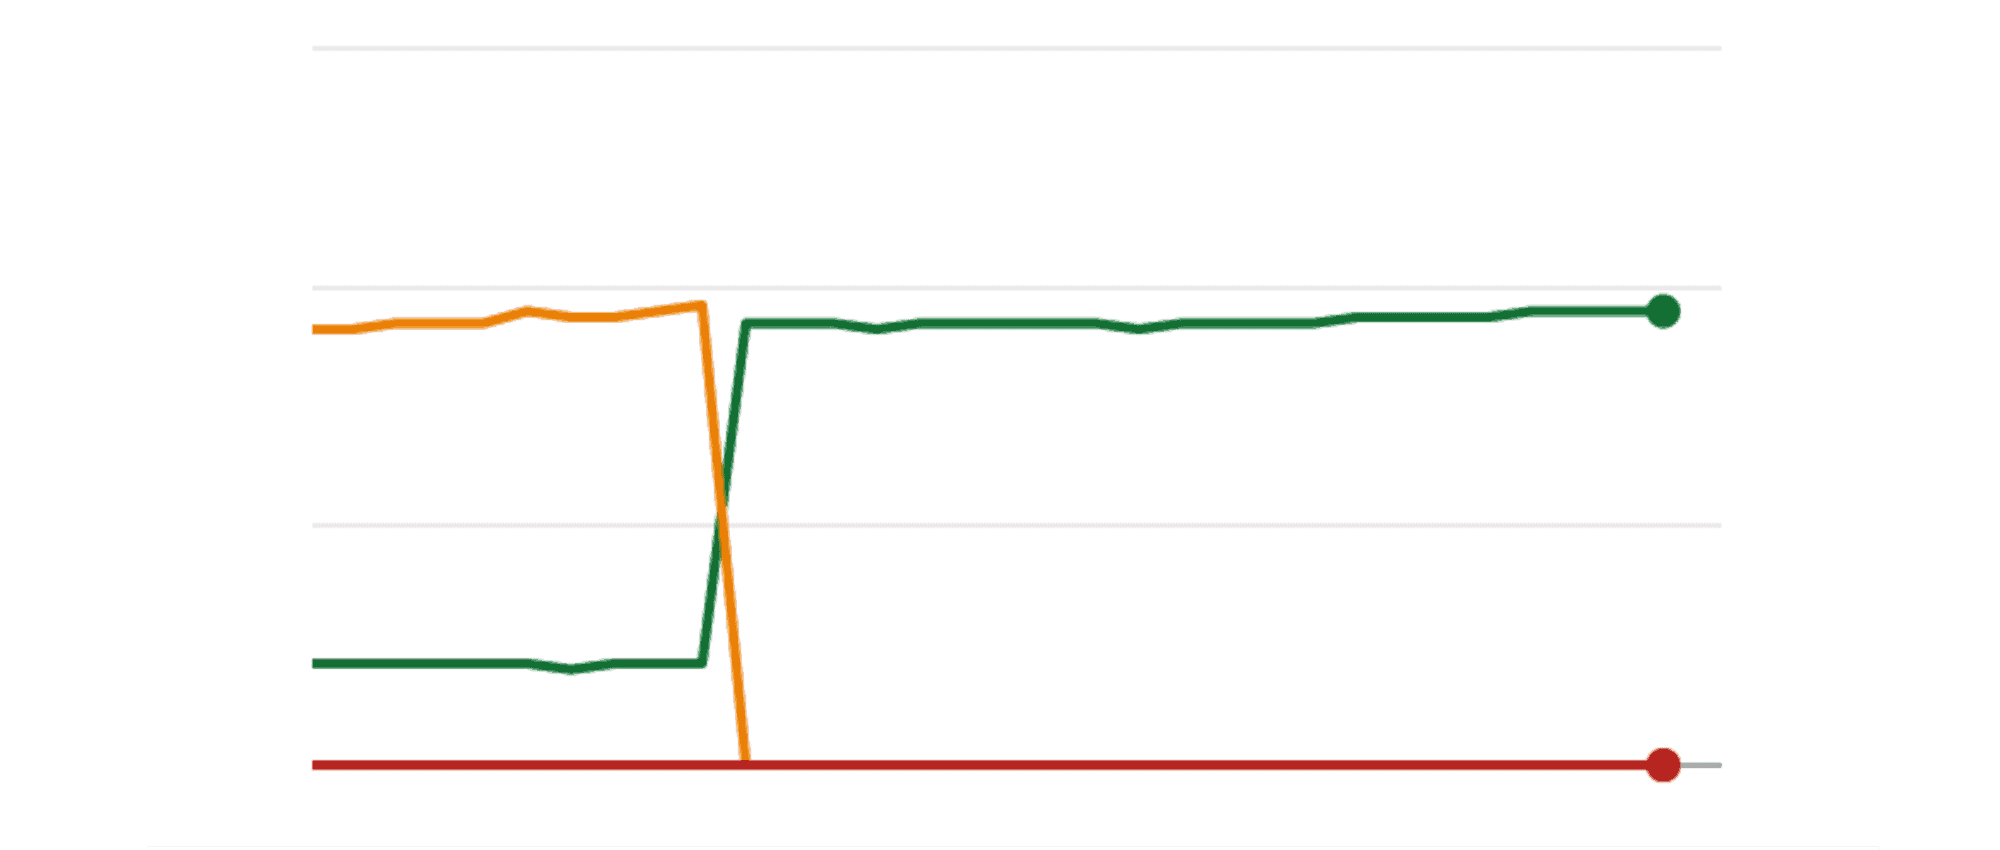
Source: Smashing Magazine.
This delay in reporting is why we recommend installing RUM tools to surface and validate new metrics and changes faster.
Phase 5. Continuous monitoring
Optimizing page experience never ends. It’s a continuous process and iterative work. In fact, research from Google has shown that most web performance metrics regress within six months.
Consequently, it’s critical to implement continuous monitoring. It will allow you to spot trends, track regressions, and identify new issues via proactive alerts. Here once again, RUM tools can play a significant role.
If you can’t afford RUM tools, leverage Google’s free APIs, summarized in the table below.
In the following sections, we will do a deep dive into each CWV to answer the critical questions when optimizing for airlines websites:
- What is each CWV in detail?
- How to debug CWV issues?
- What are the most common optimizations?
- What are the specific recommendations for flight pages on airlines websites?
Let’s dive in!
