Chapter 5: First Input Delay (FID)
First Input Delay (FID) measures the time from when a user first interacts with a page to when the browser can respond to that interaction.
In other words, FID aims to capture load responsiveness (interactivity) or how fast a page responds to user interaction.
FID is evolving, but its current definition splits out three critical concepts to understand.
FID only measures discrete events as user interaction, such as clicks, toggling, taps, and key presses. Events that FID measures as user interaction are part of the Response aspect of the RAIL model, precisely the following:
- click
- keydown
- mousedown
- pointerdown (only if it is followed by pointerup)
Other types of user interaction, like zooming or scrolling, won’t impact FID.
FID only considers the first input because:
- The first time a user interacts with your page will shape the user’s first impression of your page responsiveness.
- The most critical interactivity issues occur during page load.
- Slow input delays after page load may require different solutions.
FID measures input delay, not processing. Thus, FID measures the time the browser takes to respond to the user interaction event, not the event processing time itself. The diagram below illustrates this idea.
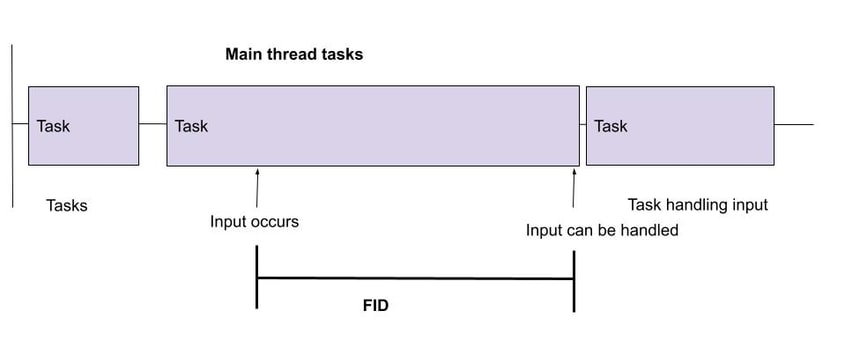
Source: Google
Measuring FID
You can measure FID in the field using any of these tools:
- Chrome User Experience Report
- PageSpeed Insights
- Core Web Vitals report in Google Search Console
- web-vitals JavaScript library
- Event Timing API
- FID is measured in milliseconds (ms), and it should be equal to or less than 100 ms.

FID is all about probabilities because:
- Some users will have no FID values (not everyone will interact with your page).
- Some users will have low FID values (they interact at good times when the browser’s main thread is idle).
- Some users will have high FID values (they interact at bad times when the main thread is busy).
Even though the threshold for all CWV is the 75th percentile, Google recommends looking at the 95th–99th percentiles for FID. That’s because the higher percentiles correspond to the awful first experiences users are having with your page.
Lab and Field Data considerations
Because it requires real user interaction, FID cannot be measured in lab tools. That’s quite a limitation when it comes to debugging FID issues.
However, a helpful lab metric has been around for a while and serves as a proxy for FID: Total Blocking Time (TBT). Generally, improvements in TBT correspond to improvements in FID.
TBT is not exactly FID, though. TBT measures the amount of time during which the main thread was blocked and prevented input responsiveness. TBT adds together the blocking time for each Long Task that blocked the browser’s main thread for more than 50 ms, without considering user interaction.
Additionally, TBT won’t consider the delay produced by the double-tap to zoom user interaction on pages not optimized for mobile viewing. Double-tap to zoom causes a delay of 300 ms after the first tap because the browser is trying to determine whether a second tab will come. This delay is not a Long Task, and thus it won’t count towards TBT. Yet, it will impact FID.
So, there are differences between FID and TBT, but both metrics correlate. Optimizations to TBT in the lab should lead to improvement to FID for your users.
You can measure TBT in the lab with:
A final consideration to keep in mind is that lab tools will ignore cached resources. Hence, the positive impact that cache and bcache bring on performance may not be visible in lab tools.
Optimizing FID
Most causes of slow input delay are connected to the browser’s main thread being busy parsing and executing a large JavaScript file. In simpler words, the main culprit of poor FID is heavy JavaScript execution.
Optimizing how JavaScript parses, compiles, and executes is the way to go when optimizing FID.
Reduce the impact of third-party JavaScript
Third-party scripts are popular on airline websites and for a reason: they provide valuable functionalities such as analytics, ads, A/B testing, sharing buttons, and so on.
However, third-party JavaScript may also come with performance issues. This is especially true when third-party scripts are impacting the Critical Rendering Path.
Basically, when installing third-party scripts, you are adding a resource that can significantly impact FID, and it’s outside your control! Too much third-party JavaScript can keep the browser’s main thread busy and delay user interaction.
You can identify third-party JavaScript using:
Google released a great guide on identifying slow third-party scripts using Lighthouse and Chrome DevTools that you should digest.
Here is a good workflow to measure the impact of third-party JavaScript using WebPageTest:
- Find the largest contributors to the Total Blocking Time (TBT)
To start, go to WebPageTest and configure the test:
- Enter affected URL
- Change Test Location to the airline’s most popular location
- Change Browser to Motorola G (gen 4)
- Under Test Settings, set Connection to 4G
- Set the Number of Tests to Run to 9
- Leave everything else as default
Once again, read Matt Hobbs’ guide to running a WebPageTest test to know more details about configuring a test in WebPageTest.
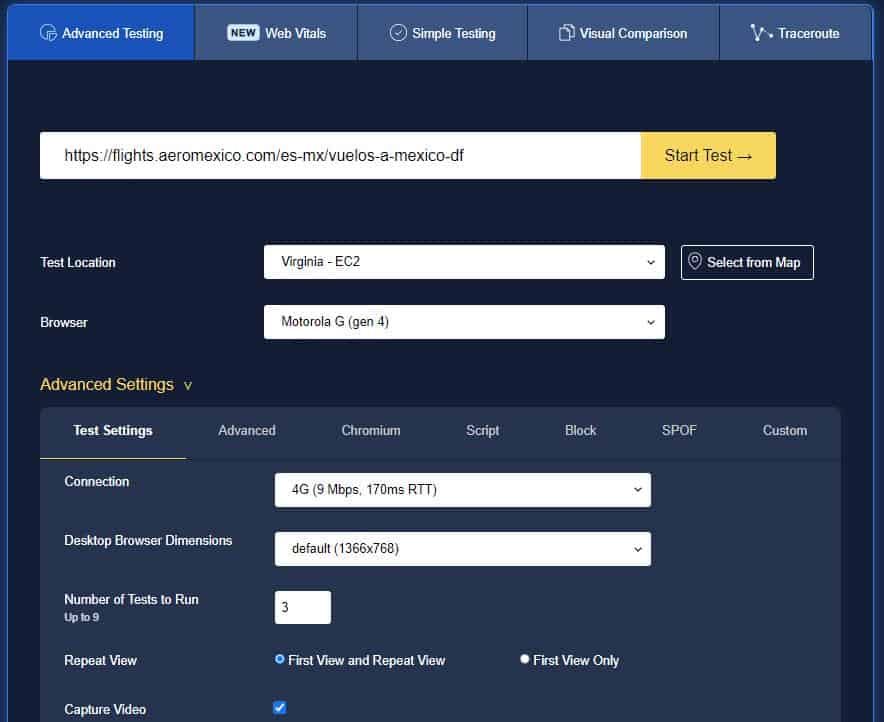
On the next page, click on Total Blocking Time (TBT), the proxy metric for FID.

Then, you will see a table with a list of third-party scripts adding to the TBT.
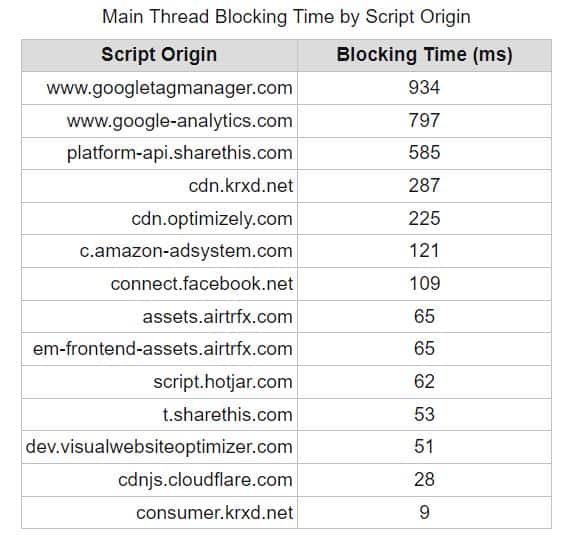
For example, the table above shows that Google Tag Manager significantly adds to the blocking time.
- Identify scripts triggering Long Tasks after the initial content renders
Just because a third-party script is causing high TBT, it does not necessarily mean that it’s the cause of poor FID. The script may be indeed blocking the main thread, but users typically don’t interact with the page when the blocking occurs.
That’s why you should try to identify which third-party JavaScript is blocking the main thread when users are likely to interact with the page for the first time. This is a challenging task, but you can start by finding Long Tasks produced after the initial content is rendered.
This can give you a hint about which script identified in Step 1 to prioritize.
For example, the WebPageTest filmstrip below shows a possible moment of first user interaction at 4.8 seconds, when the booking mask forms.
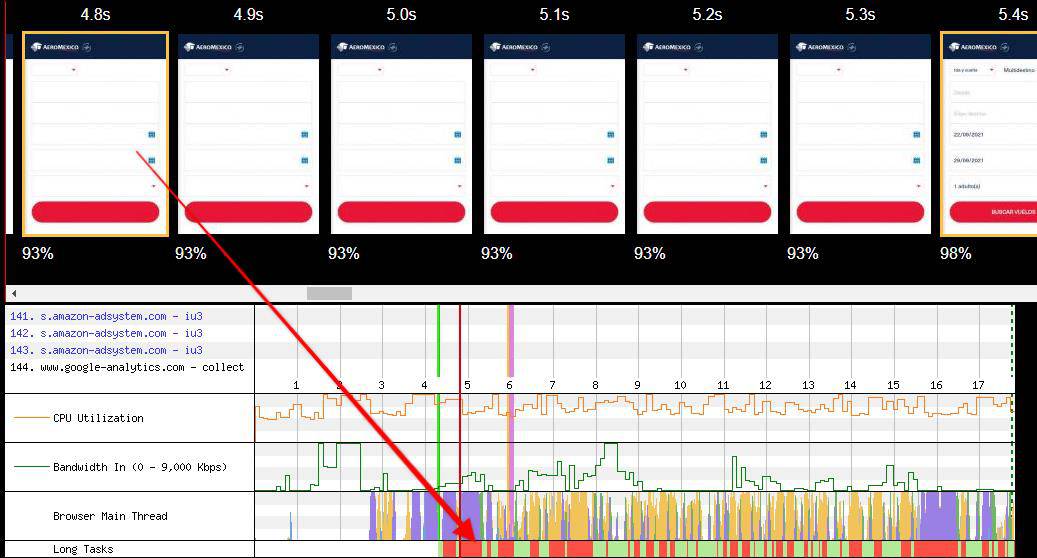
Immediately after the booking mask appears, a Long Task (red bars) runs on the main thread. The larger version of the WebTestPage waterfall shows that Google Tag Manager causes this Long Task. Thus, Google Tag Manager scripts can be a starting point for further analysis.
After the test finished running, you can get the same filmstrip for your page by clicking on Filmstrip View on the Performance Results page.
For more on reading WebPageTest waterfalls, read Matt Hobb’s guide.
- Block problematic scripts and re-measure TBT
Find out whether blocking the problematic third-party scripts significantly improves TBT. To do that, re-run a WebPageTest test, this time making the below changes to the test configuration:
- Enter affected URL
- Change Test Location to the airline’s most popular location
- Change Browser to Motorola G (gen 4)
- Under Test Settings, set Connection to 4G
- Set the Number of Tests to Run to 9
- Under Block, add the domains or URs of third-party scripts adding to TBT
- Leave everything else as default
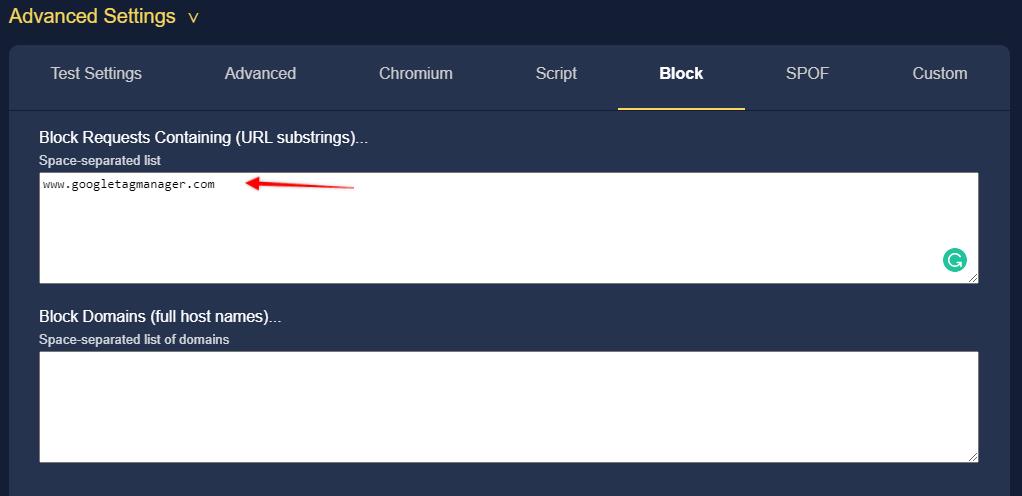
Then, run the test, sit tight, and compare the TBT before and after. To make the comparison more reliable, use the WebPageTest comparison URL generator.
Simply go to https://wpt-compare.app/, enter the original test URL and the URL of the test blocking Google Tag Manager, add relevant Labels, and click on “Generate URLs”.
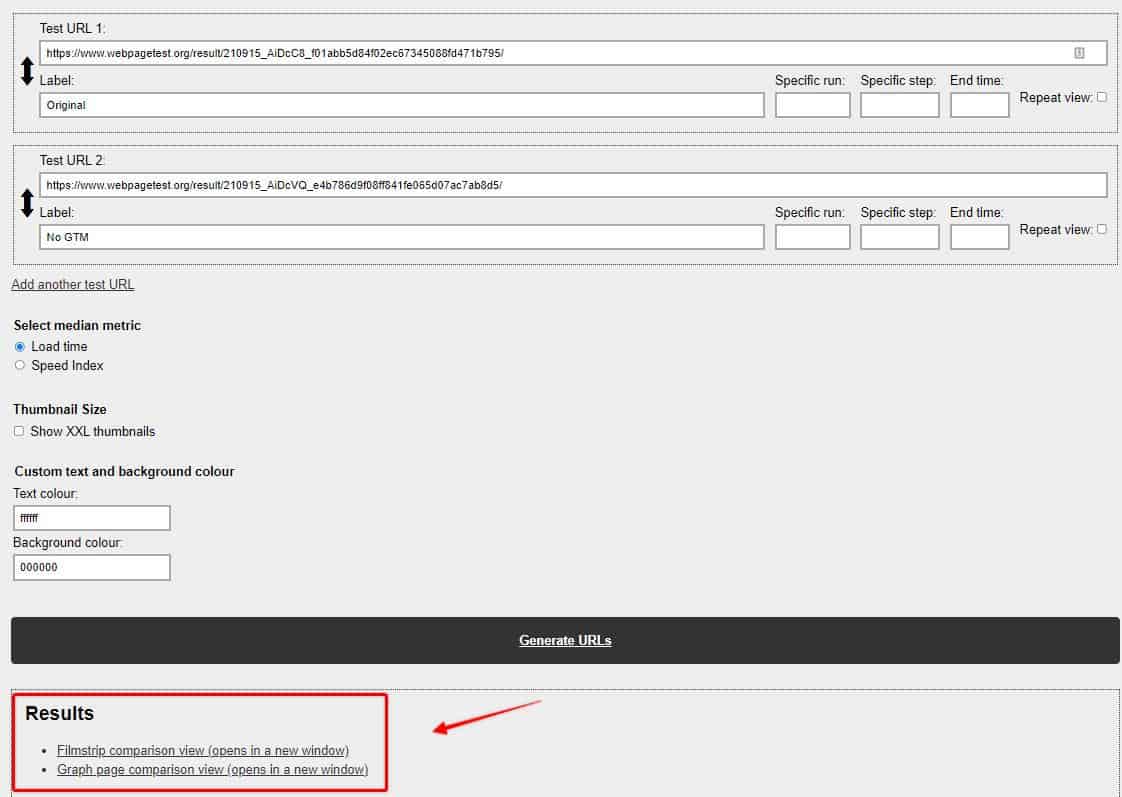
You will notice two links at the bottom, each taking you to comparison tools. Go to the Graph Page Comparison View, set the Statistical Comparison against the original test, and scroll down to find the TBT section.
You are interested in three aspects specifically:
- Whether the results are statistically significant.
- The difference TBT values at the 75th percentile.
- The range of TBT values for the set of tests.
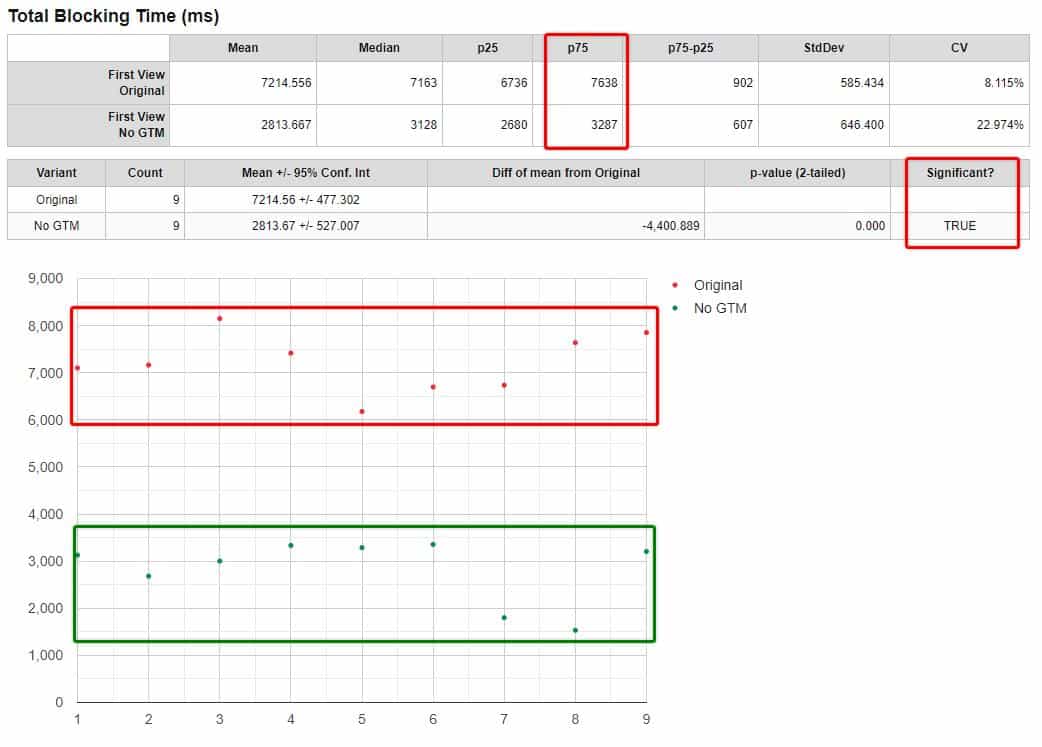
As you can see, removing Google Tag Manager would bring a significant improvement to TBT. Would it correlate to improvements in FID? It’s likely, but not guaranteed.
Additionally, fixing FID issues is pretty much an iterative process. It can take several tries before you see the desired results.
So, implement improvements, wait for a few weeks, and see how much FID improved after collecting enough Field Data.
What type of improvements can you implement? Fortunately, there are a few optimizations you can do to reduce the performance cost of third-party JavaScript.
Choose wisely
When deciding third-party resources, pick those that send the least amount of code while giving you the functionality you need.
Reduce script bloat
Remove redundant third-party scripts. You don’t need different vendors that offer the same functionality (e.g., two A/B testing tools or two analytics platforms).
Additionally, remove any third-party resource that you don’t really need!
Use async or defer
Avoid synchronous scripts unless a third-party script needs to run before the page renders. Instead, use async and defer attributes to tell the browser to load the script in the background while parsing the HTML. This way, users can see the page without waiting for the scripts to load fully.
Because async scripts execute immediately after loading, use it if you need the script to run earlier in the loading process. However, consider that async scripts can interrupt the DOM building. Good candidates for the async attribute are analytics and A/B testing tags.
Use defer for less critical resources since deferred scripts won’t block the parser. For example, you can generally defer sharing buttons, chat widgets, videos below the fold.
Establish early connections
Use preconnect and dns-prefetch to establish early connections with third-party origins and save a few hundred milliseconds.
Use <link rel=”preconnect”> to start a connection with another origin as early as possible. It involves the DNS lookup and TCP handshake, and TLS negotiations. Be mindful of unnecessary preconnecting because it can delay other resources. Thus, only use the preconnect hint for the most critical resources.
On the other hand, <link rel=”dns-prefetch> instructs the browser to resolve the DNS of another origin before it’s called. So, it handles a limited aspect of the connection to an external domain. The dns-prefetch hint is more suited to less critical third-party resources.
Lazy-load third-party resources
Lazy-loading can help to ease the negative performance impact of third-party resources. This is especially true for those resources that are not critical or render below the fold (e.g., ads, embedded videos, etc.).
Lazy-loading third-party scripts in a proper way will help the browser get the main content faster, and your page will deliver a better user experience.
Self-host third-party scripts
Self-hosting third-party scripts is a great way to take control over the loading process of those resources. Although self-hosting comes with some downsides (e.g., they won’t be automatically updated), it can let you take advantage of reduced DNS lookup time, improved HTTP caching, and the benefits of HTTP/2 server push.
Follow best practices for tags and tag managers
Tags are marketing and analytics snippets of code to collect data, set cookies, or integrate third-party content. Mismanaged tags can become a major cause of page performance issues.
To keep third-party tags under control, you must follow a series of best practices.
Establish a tag governance process
Implement a third-party tag vetting process, including:
- Legal vetting: whether the tag complies with all legal requirements (e.g., GDPR, CCPA, etc.)
- Need: whether a tag is required on a page.
- Ownership: who will be the person or team that will take ownership over the tag.
- Purpose: it’s essential to create cross-functional communication to understand why the tag is on the page.
- Review: tags need periodic revisions to prevent tag bloat on the site.
Not all scripts should be loaded using a tag manager
Tag managers are an excellent solution for implementing non-essential third-party resources (e.g., Facebook pixels, chat widgets below the fold, etc.). That’s because a tag manager will generally delay third-party scripts, which can positively impact FID.
However, tag managers are not great for loading resources that trigger visual or functional aspects on a page. Examples of those functionalities include GDPR notices, hero images, or anything page functionality above the fold. Using tag managers to load those resources can negatively impact LCP and CLS!
Remove duplicate and unused tags
On many occasions, the number of tags created in a tag manager can get out of hand. It can also happen that you have the same tag implemented through a tag manager and hard-coded. This can significantly impact a page’s performance in a negative way.
Audit your tag manager and remove any duplicated or unused tags. Remove or pause the affected tags, not just block them. That’s because blocking a tag through a trigger exception does not remove the tag from the container.
Use Custom Templates when possible
If you are using Google Tag Manager, consider using Custom Templates rather than Custom HTML tags when possible.
Due to greater restrictions, Custom Templates are less impactful on performance than Custom HTML tags. The downside is that Custom Templates may not work for all cases.
In some cases, you can convert a Custom HTML tag into a Custom Template using the injectScript API.
If you do have to use a Custom HTML tag, consider the following:
- Don’t copy and paste libraries or large third-party scripts into the Custom HTML tag. Instead, inject the third-party script via a script tag that downloads an external resource (for example, <script src=”external-scripts.js”>). Although this strategy adds a separate round-trip to download the script’s contents, the upside is that it decreases the container size and allows the browser to cache the script separately.
- Although some third-party vendors recommend placing their script at the top of the <head>, you may not need to do so. That’s because scripts loaded via a tag manager are generally executed once the browser has already finished parsing the <head>.
- When debugging performance issues, keep in mind that most synthetic tools will attribute the performance impact of a Custom HTML tag to the tag manager rather than to the tag itself.
Use pixels when possible
Pixels are the most performant tag type, followed by Custom Templates, and Custom HTML tags as the least performant.
The downside to using pixels is that they support less functionality. However, in some cases, third-party scripts can be replaced with pixels. Check with your third-party vendors to see if they support pixels.
Alternatively, if you are using your own beacons, consider modern pixel alternatives, such as the navigator.sendBeacon() and fetch() keepalive APIs.
Choose good triggers for individual tags
As a general rule, the earlier a tag fires, the bigger the impact on performance. Experiment with different triggers to find that that will satisfy your needs and minimize the performance impact at the same time.
Custom Events could be convenient in some cases because they will allow you to fine-tune when a tag fires.
Additionally, choose specific trigger conditions to ensure that tags fire when they are actually needed.
Load the tag manager at the right time
Choosing good triggers for tags is great, but adjusting when your tag manager loads can also positively impact performance. Experiment with the loading times of your tag manager and change it until it balances your needs with the page performance.
Optimize the tag containers
Use separate containers if needed. For example, a website and a mobile app may require different containers because they are structured differently.
However, as a general rule, try to stick to one container per page. Multiple containers on a page can trigger important FID issues and other performance problems. If you need to deploy various containers per page, follow Google’s guidance to do it the right way.
We all have been there. Your SEO agency wants to install its own Google Analytics snippet. The social media marketing team needs to enable the Facebook, Pinterest, and Twitter tracking pixels. Your customer service team wants a chat widget on the site. The CRO people demand the Google Optimize script on the page to start running experiments.
Generally, airlines marketing teams work with multiple vendors, agencies, and cross-departmental teams. When there is no tag governance process, third-party tags can quickly get out of control, and a page can end up with several tag manager containers. This is a widespread source of FID issues for airlines.
For example, here is how a JavaScript waterfall looks like on a page for the largest airline in Mexico.
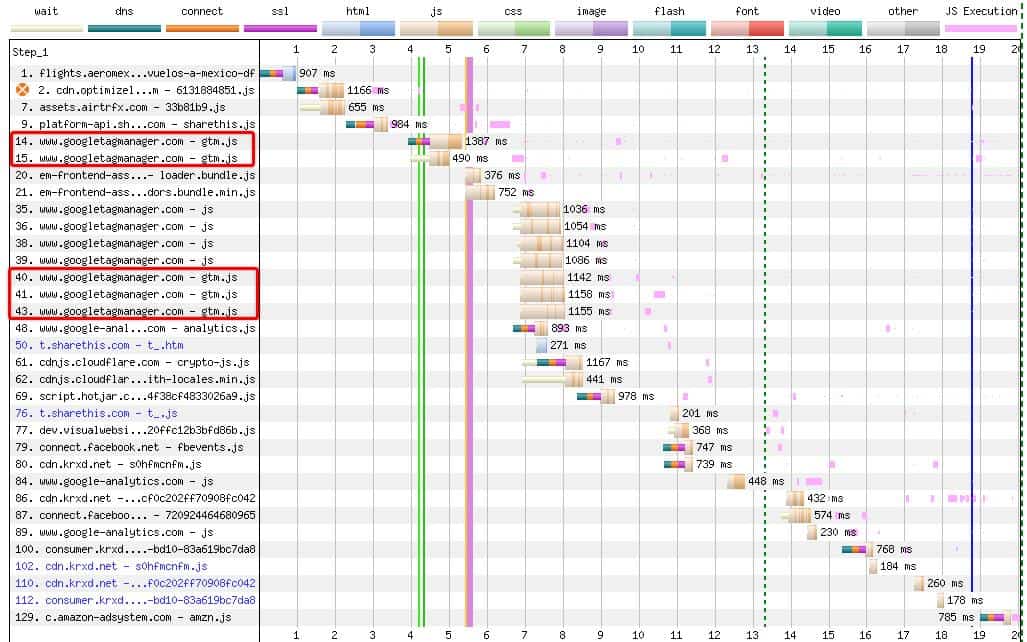
Five Google Tag Manager containers!
Avoid multiple tag manager containers whenever possible. You can do that by consolidating all tag managers, establishing a tag vetting process, and removing redundant tags.
Additionally, monitor the container size since a large container will impact your page performance. The container size depends on its tags, triggers, and variables. Google Tag Manager, in particular, limits the container size to 200 KB, but you should aim at way less than that.
Dozens or hundreds of third-party tags usually fill tag managers on airlines’ sites. For example, the waterfall below shows Adobe Tag Manager triggering a Long Task in the browser’s main thread, likely causing input delays.
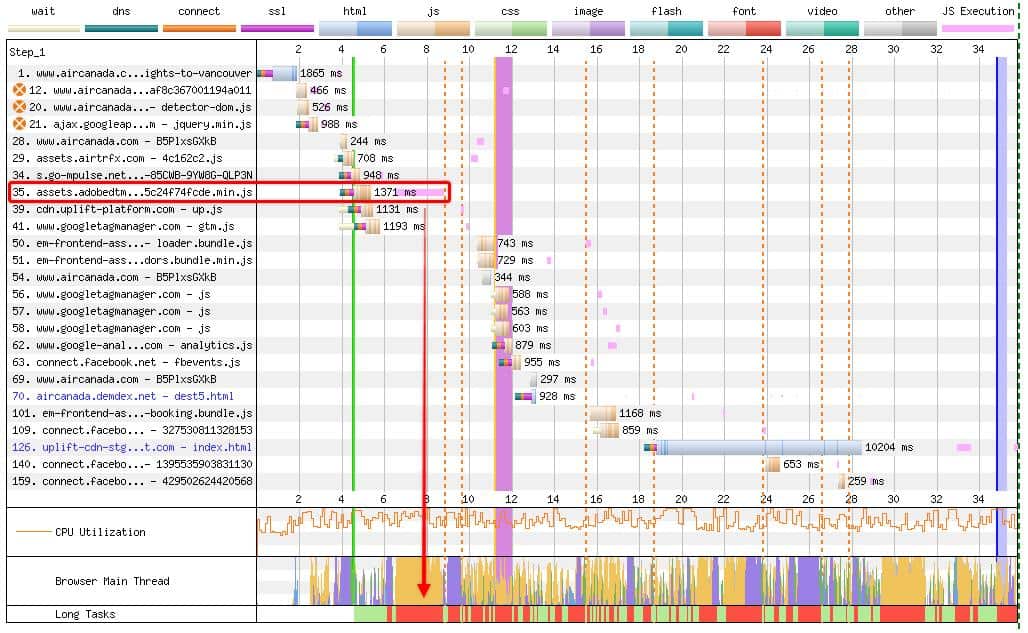
You probably don’t need a bloated tag manager container like that!
Consider using server-side tagging
Use server-side tagging for third-party scripts that support it. Switching to server-side tagging can give you more control over the data and offloads processing from the browser to the server, positively impacting performance.
Periodically audit tag usage
To avoid the accumulation of unnecessary tags, conduct an audit of your tag manager periodically. This practice will help you detect duplicate and unused tags, monitor the container size, and review complex deployments.
Optimize first-party JavaScript
Your JavaScript can also cause critical FID issues since it can block the browser’s main thread for extended periods. Large first-party scripts may execute on the main thread even before it’s actually needed.
First-party JavaScript is almost always a cause of poor FID on airlines’ websites. For example, the waterfall below shows a large chunk of first-party JavaScript triggering a Long Task, blocking the main thread for a long time.
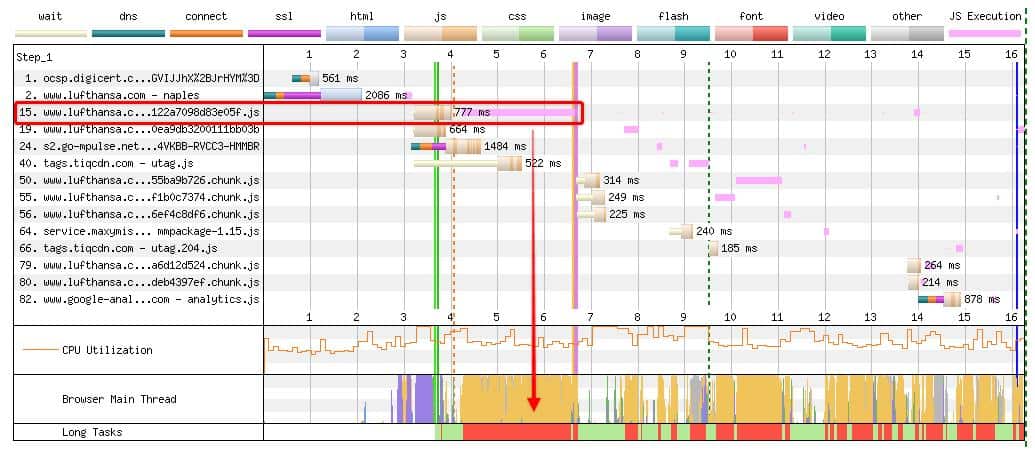
Below are some strategies that you can use to minimize the impact of your own JavaScript on FID.
Reduce the amount of first-party JavaScript
Limiting the amount of JavaScript will reduce the JavaScript execution time on the main thread. This will allow the browser to respond faster to user interactions.
There are two main ways to reduce the amount of JavaScript on a page.
Defer unused JavaScript
A page should load the JavaScript that’s really needed. Unnecessary JavaScript will overload the main thread and cause input delay.
You can detect unused JavaScript in the Coverage tab in Chrome DevTools. Open Chrome DevTools, press Ctrl + Shift + P to run a command, and type Show Coverage. Then, reload the page, and select JavaScript in the dropdown next to the URL filter.
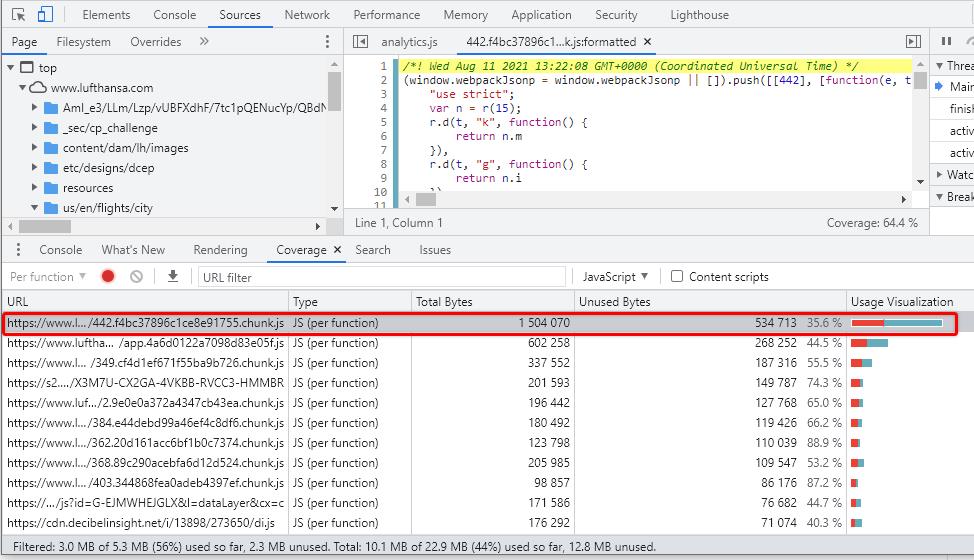
Additionally, PageSpeed Insights and Lighthouse can also flag unused scripts.
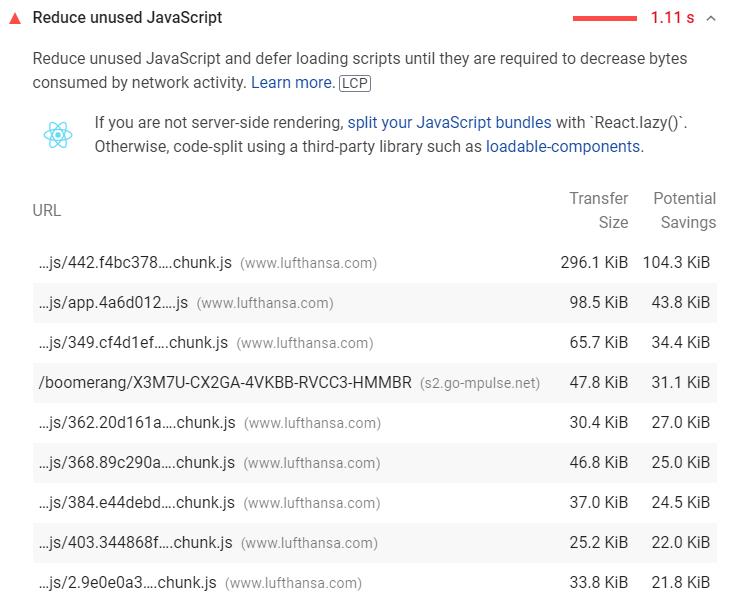
You can defer unused JavaScript by using the defer or async hints, as explained earlier.
Code-split your bundle into multiple chunks
Another way to cut down the number of first-party scripts is to code-split your large JavaScript bundles into smaller chunks that can be lazy-loaded.
Code-splitting Long Tasks that block the main thread into smaller, asynchronous tasks will significantly reduce input delay on your page.
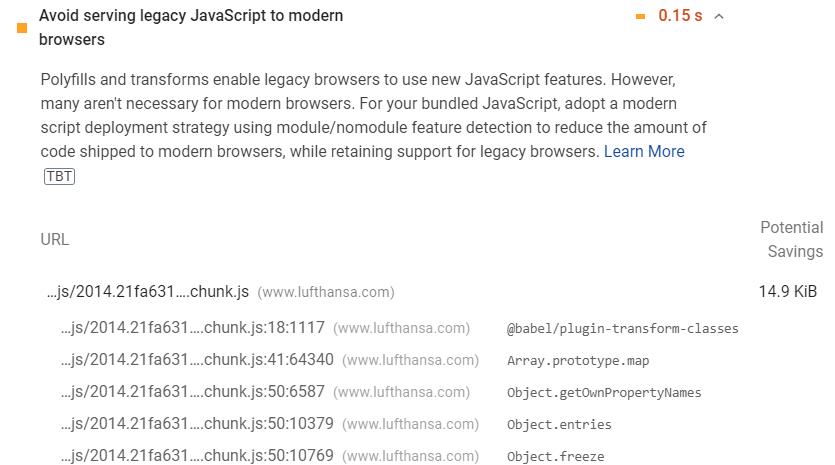
Minimize unused polyfills
Serve modern code to modern browsers for better page performance. Particularly, restrict the use of polyfills and reduce unused polyfills.
Lighthouse or PageSpeed Insights can detect JavaScript using polyfills.
Minify and compress your code
Minification and compression of JavaScript will reduce file size, which can help the browser process your scripts faster.
Avoid document.write()
document.write() is an old known culprit of poor page performance. Because document.write() dynamically injects another script, it can stop the parser for a long time until the resource is downloaded. Thus, document.write() may increase network round-trips, delay the page rendering, and potentially block the main thread.
Using Lighthouse or PageSpeed Insights, you can see whether there are scrips injected via document.write() on your page.

Google’s official recommendation is simply to avoid document.write(). Do not inject scripts using document.write() or replace those that are using it.
Use service workers
Service workers can run JavaScript on the worker thread, reducing the workload on the browser’s main thread. This will end up in less blocking time and improve FID.
Additionally, using service workers to cache third-party scripts is a middle-ground solution that will allow you to benefit from the third-party CDN, while also taking greater control of the loading process. For example, you can define how often third-party resources will be re-fetched from the network.
Idle until urgent
Idle until urgent is a strategy developed by Philip Walton to reduce FID. It allows the browser to run JavaScript during idle periods while guaranteeing that any needed code will run immediately. This approach frees up the main thread and can significantly improve FID.
Companies like Netzwelt have used this method to optimize their site’s FID.
Set a mobile viewport
Many browsers allow users to double-tap to zoom content that is not mobile-friendly. This usually happens when the content is on pages without an explicit <meta name=”viewport”>. Because a browser needs to wait up to 300 ms after the first tap to see if a second tap will follow, pages without the viewport will have poor FID.
Therefore, even though setting a viewport has been recommended for a while, it’s worth stressing its importance to achieve good FID. This is now a recommendation in Lighthouse and PageSpeed Insights.

