Chapter 4: Largest Contentful Paint (LCP)
The Largest Contentful Paint (LCP) measures how long it takes for the largest content within the viewport to render. In other words, LCP measures when the largest image or text block above the fold becomes visible.
The types of content elements considered for LCP are:
- <img> elements
- <image> elements inside an <svg> element
- The poster image is used for <video> elements
- A background image loaded via the url() function
Block-level elements containing text nodes or other inline-level text elements children.
Because CWV will continue to evolve, other element types may be added in the future (e.g., <svg>, <video>).
There are a few caveats about calculating the size of the largest contentful element that you must consider:
The size of a content element is the size visible within the viewport. Any portion of an element that is not visible within the viewport does not count towards LCP. For example, LCP won’t consider element portions clipped or that extend outside the viewport. Additionally, any margin padding or border element applied with CSS won’t impact LCP.
Any late-loading element can be considered the largest contentful element once it becomes visible to the user. For example, a smaller element (e.g., <h1>) may be reported as the largest element early in the loading process. Still, as soon as a larger element finishes rendering (e.g., a background image), the latter will be considered for LCP. This is also true for new elements added to the DOM.
Only the element’s initial size and position in the viewport are considered. Thus, elements initially rendered in the viewport that later go off-screen can still become the LCP element. On the other hand, elements that were initially rendered off-screen and then transitioned into the viewport will not be considered.
Even if a current largest element is removed later from the DOM, it will remain the largest element (unless a larger contentful element renders).
No new contentful elements will be considered for LCP after user interaction (tap, scrolls, keypresses).
With those caveats in mind, let’s get into measuring and optimizing LCP.
Measuring LCP
LCP is measured in seconds and is in the Good threshold when less than or equal to 2.5 seconds.

Source: Google
You can measure LCP in the field with any of the following tools:
- Chrome User Experience Report
- PageSpeed Insights
- Core Web Vitals report in Google Search Console
- web-vitals JavaScript library
- Largest Contentful Paint API
In the lab, it’s possible to measure LCP with:
Lab and Field Data considerations
When looking at Lab and Field Data for LCP, you may find several inconsistencies. As we discussed earlier, inconsistencies between Lab and Field Data are due to their different nature. Lab Data is generated in a controlled environment while Field Data captures your actual users’ networks, devices, and behaviors.
Because of these differences, you may find an LCP element in the lab that may not be the same in the field. While the LCP element in lab tools will remain consistent if you make no changes to the page, the LCP element for your real users may vary. Several factors can contribute to this:
- Different elements within the viewport due to different device screen sizes.
- Personalized content can show a different LCP element from user to user.
- A/B tests can display different LCP elements for users.
- In the lab, the browser will wait for a page to fully load to determine the LCP element. However, in the field, the browser will stop detecting LCP elements after the user interacts with the page (e.g., scrolls, taps, clicks, etc.). Hence, the LCP element will be different and likely faster in the field.
- Fonts on the user’s system can change the text size on the page. Consequently, the LCP element may change too.
- Users can share or visit variations of a page’s URL rather than the page’s “base” URL. Since a lab test is generally run on a page’s “base” URL, the LCP element may differ from that shown in the field. For example, for users landing on a URL containing a fragment identifier or text fragment, the LCP element may be at the middle or the bottom of the page.
Another key factor that may cause discrepancies in LCP measurements is that lab tools will generally ignore the effects of cache and bcache. Lab tests run on a page with a cold cache, but real users may already have cached the page’s resources. Therefore, LCP scores may be better in the field.
Finally, lab tools can’t fully capture the benefits of platform optimizations such as AMP and Signed Exchanges (SXG). This will result in slower LCP in the lab while, in reality, it will be faster for your actual users.
Optimizing LCP
Before even looking at what you can do to optimize LCP, you need to find the LCP element. As explained above, the LCP element in the lab may be different from that in the field. That’s why it’s essential to use both lab and RUM tools when debugging LCP.
All lab tools we have mentioned so far allow you to detect the LCP element.
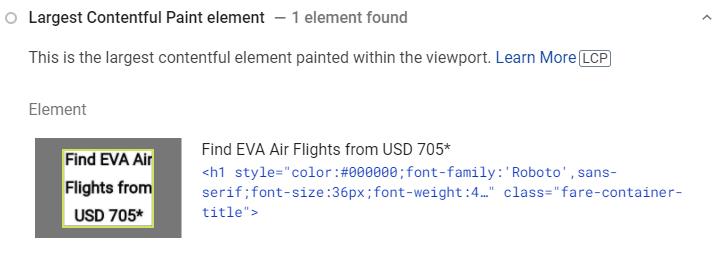
For example, Lighthouse and PageSpeed Insights will tell you what is the LCP element in Diagnostics:
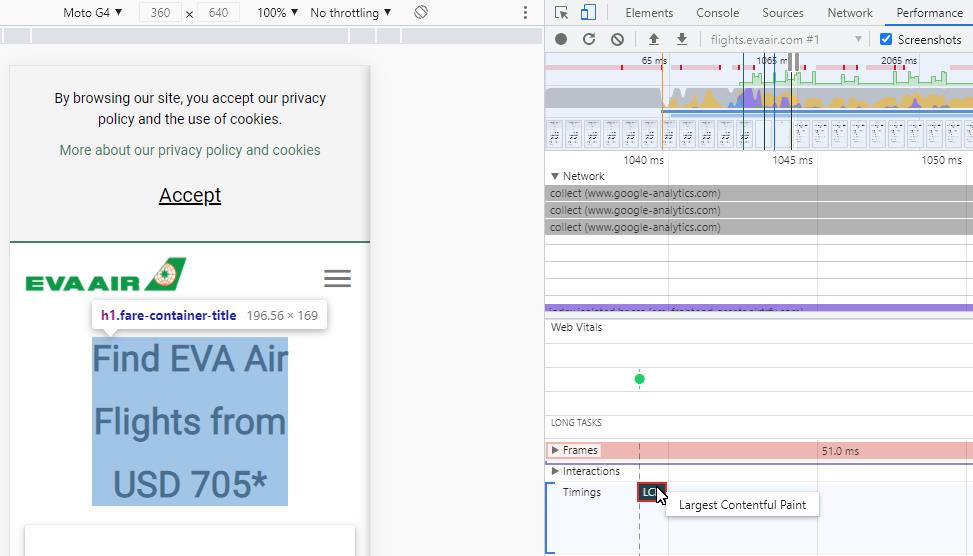
You can also use the Performance report in Chrome DevTools to identify the LCP element:
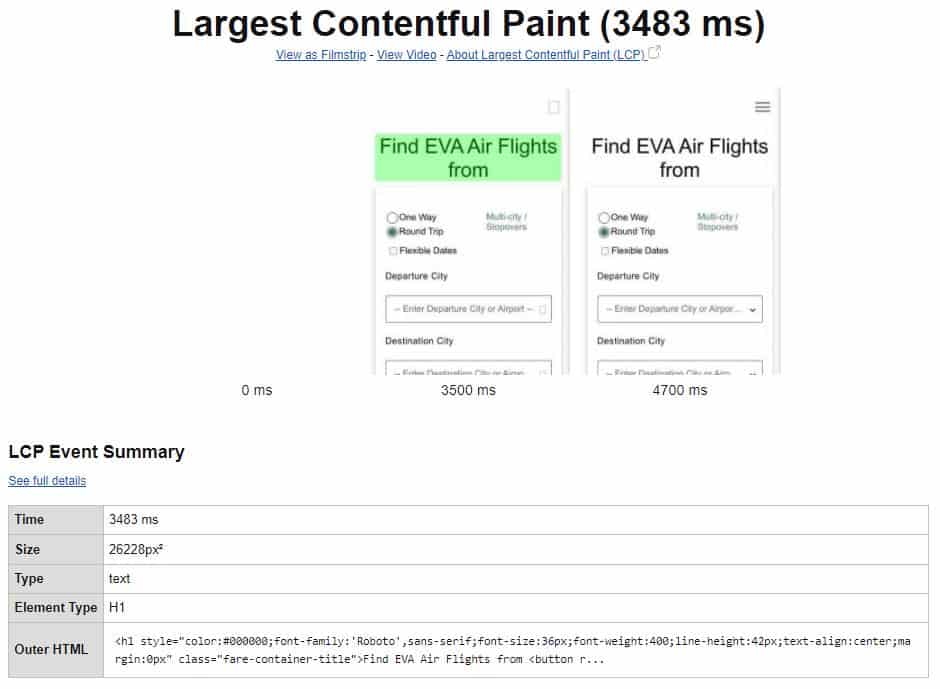
Finally, WebPageTest provides a dedicated LCP report where you can see more details about the LCP element:
Once you know the LCP element, move to analyze the potential causes of poor LCP for your page. The causes of poor LCP are primarily connected to:
- Slow server response times
- Render-blocking JavaScript and CSS
- Slow resource load times
In the following sections, we will talk about improving LCP using specific performance techniques.
Fix slow server response times
You can use Time to First Byte (TTFB) to measure your server response times. As a general rule, the higher the TTFB, the longer it will take for a page to render the LCP element.
According to Google, your server response time should be less than 600 ms. Anything more than that indicates room for optimizations.
In Lighthouse and PageSpeed Insights, you can see what the server response time is in the lab.
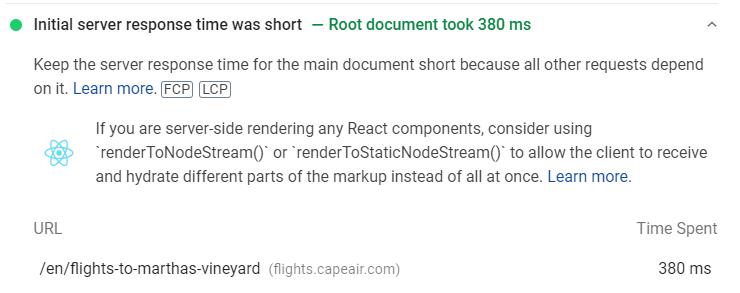
There are several techniques you can implement to improve server response times.
Optimize your server
First and foremost, improve the efficiency of your server-side code. Fixing bottlenecks, avoiding expensive queries, and serving a static page on a browser request are just some of the ways to optimize your server.
An optimized server will ultimately improve LCP for your users.
Use a CDN
A Content Delivery Network (CDN) is a network of servers geographically distributed. A CDN can speed up network requests and ultimately reduce LCP. That’s because your users worldwide won’t need to wait for the response of a single server located far away.
When choosing a CDN, ensure that it supports the most advanced features such as file compression, image optimization, service workers, etc.
Consider HTTP/2 or HTTP/3
Make sure that both your server and your CDN support HTTP/2 or HTTP/3 since it can bring a substantial performance boost.
Cache assets
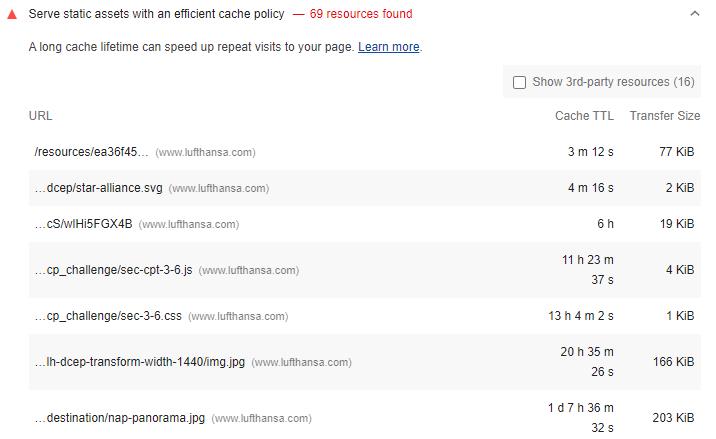
Cache your static assets on the server to avoid being recreated needlessly. Server-side caching will reduce TTFB and improve LCP.
Lighthouse and PageSpeed Insights will flag all static resources that don’t have an efficient cache policy.
Avoid multiple page redirects
Page redirects will increase HTTP request-response cycles, slowing down your server response time. This includes HTTP-to-HTTPS redirects too.
You can save hundreds of milliseconds of server response time if you manage to prevent unnecessary page redirects. To eliminate the HTTP-to-HTTPS redirect latency, submit your origin to the HSTS preload list.
Use a service worker to serve cache-first HTML
One of the lesser-known but powerful capabilities of a service worker is that it can serve HTML pages cache-first and only update the cache when the content changes. In other words, a service worker can programmatically transform a minimum of data (e.g., an HTML content partial, a markdown file, JSON data, etc.) into a complete HTML document.
With this technique, the service worker will intercept requests for pages and request only what is inside <main>. Then, the service worker will combine the HTML in cache with the new content. Voila!
Serving partially cached HTML pages via a service worker can substantially decrease LCP. Therefore, this technique is worth considering.
Establish third-party connections early
Use preconnect and <dns-prefetch> to establish early connections with third-party origins that display critical content on a page.
The <link rel=”preconnect”> helps the browser connect with another domain as early as possible. It involves the DNS lookup and TCP handshake, and TLS negotiations. The preconnect hint is preferred for critical resources.
Alternatively, use <link rel=”dns-prefetch”> to instruct the browser to resolve the DNS lookups faster. The dns-prefetch hint is less encompassing than the preconnect hint, and it’s recommended for less critical third-party resources.
Use Signed Exchanges (SXGs)
Signed Exchanges (SXGs) can substantially improve LCP by providing easily cacheable content. SXGs can be particularly useful for sites that receive the most traffic from Google search. That’s because Google will cache and prefetch SXGs.
Reduce the impact of SSL certificate revocation
Online Certificate Status Protocol (OCSP) revocation checks can significantly impact performance. Specifically, OCSP revocation checks will open one or more TCP connections, increase round-trip times, and block rendering. Thus, OCSP revocation checks can indirectly delay LCP.
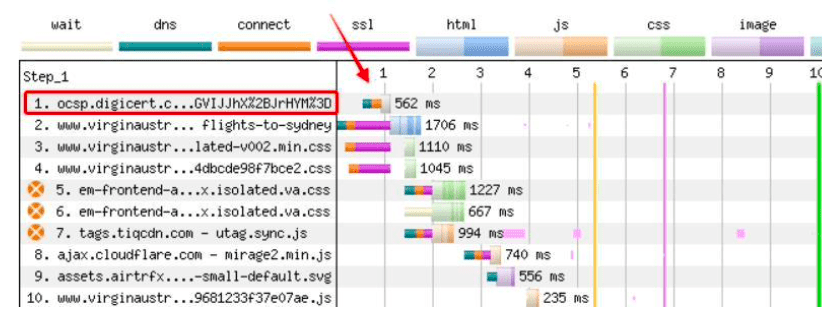
There are two ways to reduce the impact of SSL certification revocation on performance:
- Enable OCSP stapling, including immediate certificates.
- Consider dropping EV certificates. Even with OCSP stapling enabled, Chrome is going to run an OCSP renovation check. So, there is no way to get rid of this issue when using an EV certificate. The good news is that you may not even need an EV certificate at all.
Reduce render-blocking resources
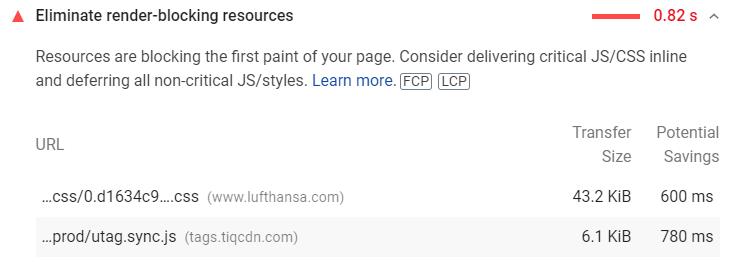
Scripts and stylesheets are render-blocking resources by default. Both can stop the HTML parsing, delaying the First Contentful Paint (FCP), and consequently, LCP.
You can identify render-blocking resources in Lighthouse, PageSpeed Insights, and WebPageTest.
For example, Lighthouse and PageSpeed Insights detect render-blocking resources in the Opportunities report, as shown below.
Fortunately, there are a few ways to reduce the impact of render-blocking JavaScript and CSS.
Minify CSS
Reducing the CSS file size will improve the time it takes for the LCP element to fully render. It includes removing unnecessary characters such as whitespaces, indentation, or comments.
This technique is called CSS minification.
You can validate your CSS minification in Lighthouse and PageSpeed Insights.

Defer non-critical CSS
Deferring non-critical CSS is an effective technique to optimize the Critical Rendering Path, improve FCP, and reduce LCP. This technique aims only to load critical CSS files synchronously while loading the rest in a non-blocking way.
It generally entails:
- Removing unused CSS.
- Using loadCSS to load non-critical CSS files asynchronously.
Chrome DevTools, Lighthouse, and PageSpeed Insights will prove handy to identify non-critical CSS.
Start with Lighthouse or PageSpeed Insights to find unused stylesheets.
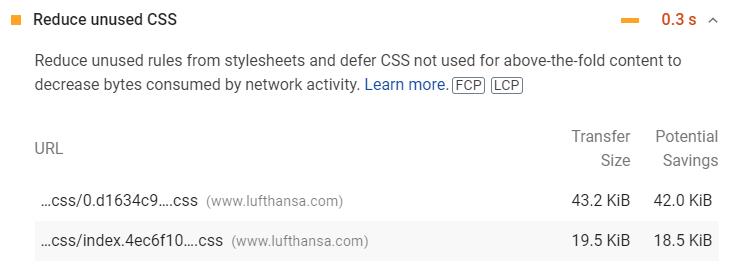
Then, head to the Coverage tab in Chrome DevTools following these steps:
- Open the affected page in Chrome.
- Open Chrome DevTools, press Ctrl + Shift + P to run a command, and type Show Coverage.
- Then, reload the page, and select CSS in the dropdown next to the URL filter.
You will see a report like this:

The almost invisible green bar represents the amount of CSS that the browser needs to render the visible content. On the other hand, the red bar represents non-critical CSS, which is CSS applied to not immediately visible content.
In this example, there is a lot of room for optimization!
Inline critical CSS
Requests for large CSS files can significantly block rendering, delaying the LCP element. You can minimize this by in-lining critical CSS. It entails extracting the CSS for above-the-fold content and including it directly in <head>.
In-lining critical CSS can improve LCP in two ways:
- It reduces round-trips to request to fetch CSS stylesheets.
- Non-critical CSS is deferred, minimizing the blocking time.
Finally, make sure that the inline critical CSS stays under 14 KB.
Avoid CSS @import statements
The CSS @import rule calls another stylesheet from within a CSS file. This prompts the browser to make additional sequential requests rather than in parallel.
Since CSS is render-blocking by default, @import can delay FCP and, consequently, LCP. Instead, use a link tag for faster stylesheet delivery.
Avoid CSS redirects
CSS redirects can cost your page hundreds of milliseconds of rendering time, especially if the redirected CSS file is render-blocking. Check for CSS redirects in WebPageTest and remove them.

Reduce JavaScript blocking time
Reducing the amount of JavaScript on the page will result in faster rendering times and consequently faster LCP.
There are a few ways to reduce the JavaScript blocking time, which we will cover later in the FID section, including:
- Minifying and compressing JavaScript files.
- Deferring unused JavaScript.
- Minimizing unused polyfills.
Improve resource load times
The time it takes to load above-the-fold elements can affect LCP. Hence, prioritize the loading times of these elements by implementing the following techniques.
Optimize images
In many cases, an image is the LCP element on a flight page (e.g., a hero image of the destination). When the LCP element is an image, you can improve its loading time in several ways:
- Compress images
- Use the right image format
- Serve responsive images
- Use a CDN
- Inline the background image in the HTML rather than using background-image
Preload important resources
Use <link rel=”preload”> to prioritize critical assets such as above-the-fold fonts, images or videos, and essential stylesheets and scripts. By preloading a resource, you ask the browser to fetch it sooner, which will speed up the rendering process and improve LCP.
When implementing preload, avoid two common mistakes:
- Omitting the as attribute, which can invalidate the request or cause some resources to be fetched twice.
- Omitting the crossorigin attribute for fonts, which will make the browser fetch the fonts twice.
Use preload mindfully, though. Modern browsers are already able to prioritize resources, so preload only the most critical resources. If everything is a priority, then nothing is. Besides, consider that too much preloading can do more harm than good.
Play with priority hints
The importance hint, a.k.a “priority hint”, indicates a resource’s relative importance to the browser. The priority hint can be very powerful for performance optimizers because it allows them to influence how resources are loaded by the browser.
With the importance hint, you can:
- Increase the priority of the LCP image.
- Lower the priority of preloaded scripts.
- Increase or lower the importance of late-body scripts.
- Provide priority differentiation on fetch calls.
For reference, check how Chrome currently prioritizes resources in this great summary.
However, you should keep in mind that the priority hint is only supported by Chrome 96 to 99 because it is currently experimental until March 2022.
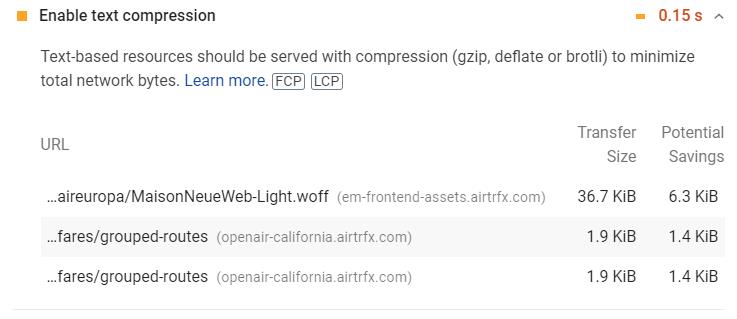
Compress text files
Another technique that can improve LCP is compressing text files transferred between the server and browser. The most popular compression algorithms are Gzip and Brotli. We recommend using Brotli as it results in better compression.
Both Lighthouse and PageSpeed Insights will detect uncompressed text files.
Inline font declarations
Inlining font declarations in <head> will allow the browser to discover the font declarations sooner rather than waiting for an external CSS file to download. This will speed up the rendering of fonts, which will improve LCP, particularly if text is the LCP element.
Consider self-hosting fonts
If your site uses a CDN and HTTP/2, self-hosting your above-the-fold fonts could render faster than third-party fonts. That’s because self-hosted fonts eliminate a connection setup.
However, don’t take it as a blanket recommendation. Experiment with self-hosted and third-party fonts and see whether the transfer time is better. Additionally, keep in mind that generally, third-party fonts come with optimizations that you should apply to self-hosted fonts (e.g., font subsetting, WOFF2 compression).
Leverage font-display
The font-display CSS descriptor determines how the browser loads and displays web fonts. You can leverage font-display to prevent common performance issues, such as FOUT and FOIT.
If text is the LCP element, FOIT can affect LCP significantly because the visible text will be delayed until the browser can load the new font.
The most performant font-display strategies are font-display: optional and font-display: swap. To improve LCP particularly, we recommend using font-display: swap.
Use adaptive serving
Adaptive serving is a way to serve different variations of the same resource depending on the user’s connection or device. Adaptive serving can be yet another tool to enhance LCP.
Cache assets using a service worker
Service workers can be used to precache critical static resources, resulting in better loading times and LCP. Learn more about using this technique on Google’s guide to adaptive loading with service workers.
Optimize the cookie notice
In many cases, consent cookie notices are small and won’t become the page’s LCP element. However, it’s not uncommon to see cookie notices becoming the LCP element, especially on mobile devices.
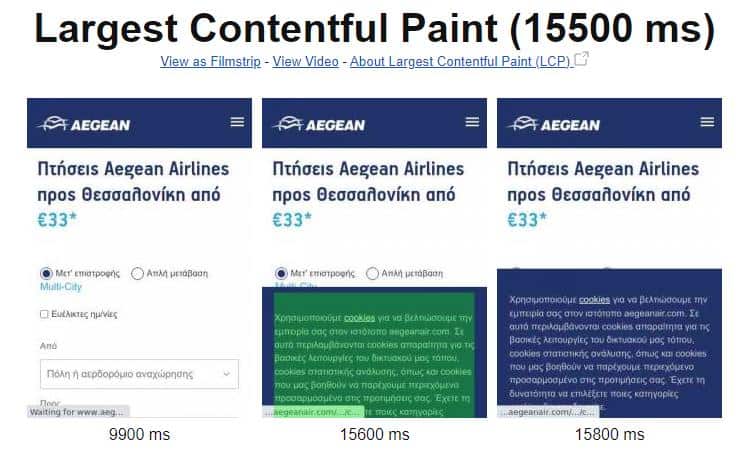
First off, you should avoid the cookie notice from becoming the LCP element because it loads far in the rendering process. You can do so in a few ways:
- Displaying the cookie notice after user interaction.
- Rendering the cookie notice off-screen and then transitioning it into the viewport.
- Splitting the text into multiple small paragraphs and making the text smaller.
- Avoid background images for cookie notices.
If you can’t prevent the cookie notice from becoming the LCP element, make sure it renders fast by implementing some best practices:
- Load cookie notices scripts asynchronously.
- Load cookie notices scripts directly by placing the script tag directly in the HTML.
- Establish early connections by using dns-prefetch or preconnect
- Preload cookie notices as appropriate. Note: keep in mind the harm that too much preloading can do to performance.
- Serve third-party cookie notice scripts server-side.
- Use service workers to fetch and cache third-party cookie notice scripts.
Consider dropping the anti-flicker snippet
Often, A/B testing software offer anti-flicker snippets to prevent users from seeing page changes as experiments execute. These snippets are helpful for user experience but also come with performance issues, particularly for LCP.
Anti-flicker snippets will show users a blank page (by using opacity: 0) until the experiment loads or 4 seconds have passed, whichever is sooner. Considering that the Good threshold for LCP is 2.5 seconds or less, you imagine the impact that anti-flicker snippets can have on LCP.
There is no simple solution to mitigate this impact, but here are a few ideas:
- Use server-side A/B testing.
- Hard code the A/B testing tool instead of loading it with a tag manager.
- Install the A/B testing script before any other JavaScript or CSS file.
- Reduce the timeout of the anti-flicker snippet to 2,5 seconds.
- Use the defer attribute to load the anti-flicker snippet when the experiment runs below the fold. For above-the-fold tests, use async.
- Drop the anti-flicker snippet entirely.
