Chapter 2: Measuring Core Web Vitals
Enter Core Web Vitals
Core Web Vitals are sub-signals of the broader Page Experience Update.
In general, Core Web Vitals includes metrics meant to represent three aspects of the user experience—loading (Largest Contentful Paint), interactivity (First Input Delay), and visual stability (Cumulative Layout Shift).
Here are the definitions and thresholds of each CWV:
Largest Contentful Paint (LCP): it represents the render time of the largest image or text component, which appears above the fold (varies according to the viewport). A good LCP score should be equal to or less than 2.5s.
First Input Delay (FID): it measures the time it takes from a user’s first interaction with the page until the browser can process the interaction event. Web developers should aim for an FID score of less than 100ms.
Cumulative Layout Shift (CLS): it’s calculated as the sum of all of the unexpected layout shift scores that occur on the entire page. A site should strive to keep the CLS score below 0.1.
We will get into more details on how to audit and optimize each Core Web Vital in later sections.
Measuring Core Web Vitals
Google claims that Core Web Vitals “capture important user-centric outcomes, are field measurable, and have supporting lab diagnostic metric equivalents and tooling.”
In this chapter, we will elaborate on measuring and understanding Core Web Vitals and the available tooling.
The Core Web Vitals thresholds
A page will pass the Core Web Vitals assessment if it meets the recommended targets for each metric at the 75th percentile of page views over a 28-day window.
The image below shows the thresholds that Google determined for each Core Web Vital.

Source: Google.
For more detailed information on how Google determined the metrics thresholds, check out the Core Web Vitals thresholds methodology.
Lab Data vs. Field Data
Core Web Vitals are measured in two ways.
In the lab (Lab Data)
Lab Data is based on a simulated page load in a consistent, controlled environment. Specifically, Lab Data is collected by emulating a Moto G4 phone on a fast 3G connection.
Lab Data does not capture data from user interactions, so First Input Delay (FID) is not available in synthetic tools. In its place, lab tools report on Total Blocking Time (TBT), a proxy metric.
Do not rely on the scores shown in Lab Data because they may not reflect the users’ experience in the real world.
In the field (Field Data)
Field Data, also known as Real User Metrics (RUM), is based on real users actually loading and interacting with the page. Field Data comes from the last 28-days of data in Chrome User Experience Report (CrUX), which collects anonymized data from actual user visits and interactions.
Google uses the 75th percentile of all page views to determine the value of each CWV. For example, a page will have a Good LCP score if at least 75% of page views meet the Good threshold.
Considering the above, an important fact to consider moving forward: Google uses 28 days’ worth of data and the 75th percentiles. We will get into more details later, but know that this computation method delays CWV reporting in all Field Data tools, which can be frustrating.
Finally, it’s important to note that Google uses Field Data to measure Core Web Vitals for search rankings.
When there is no Field Data
Field Data will only be available if your page has generated 28 days of data. If there is no Field Data, some measurement tools will display origin data; this is the Field Data for the whole domain.
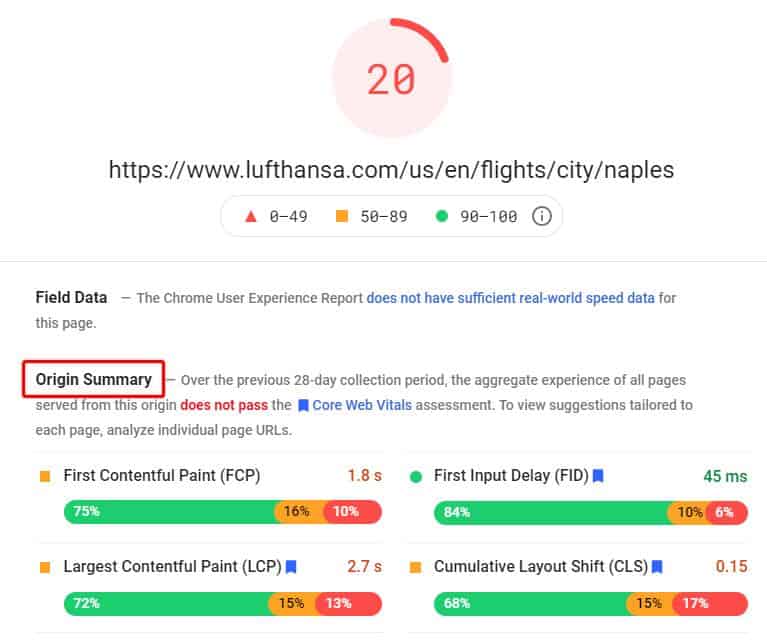
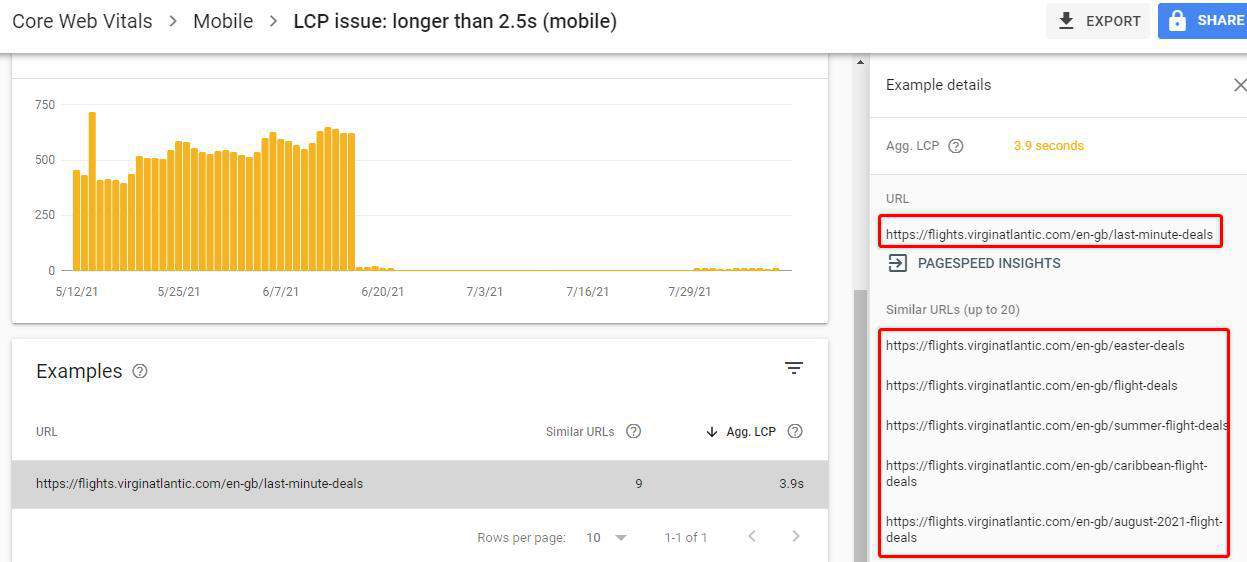
On the search side of things, if your page hasn’t generated 28 days of data, Google will compute scores for the page based on the score aggregation of similar pages. This is especially applicable to pages that receive little to no traffic.
For example, if your “Flights to Medellin” page doesn’t have enough Field Data, Google is likely to add the page to a “flights to city” bucket. Then, Google will use the aggregated score of the rest of your “flights to city” pages that do have Field Data.
The Core Web Vitals report in Google Search Console offers a great representation of how Google reports the same CWV for groups of similar pages:
Lab and Field Data discrepancies
Lab and field tools will likely report different values for CWV, even for the same page. Sometimes, your lab data will indicate that your page performs quite well while field data tells you otherwise. The opposite is true: your page’s field data may look great while lab data hints at several issues.
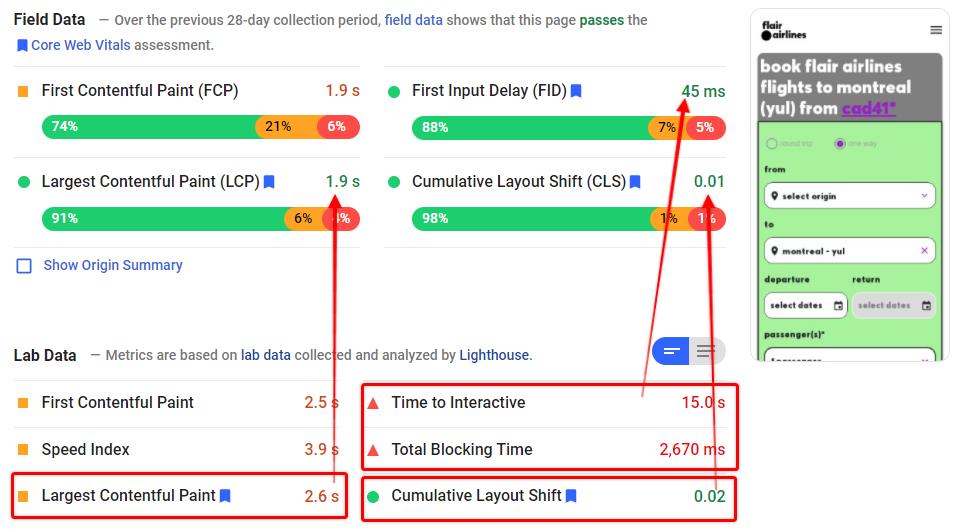
Discrepancies between Lab and Field Data are typical and expected. That’s because, as explained earlier, Field Data captures data from a variety of network and device conditions, as well as different user behaviors. It’s also impacted by browser and platform optimizations such as bcache and AMP cache.
On the other hand, Lab Data comes from a controlled environment. It primarily consists of a single device connected to a single network from a single location.
The table below summarizes the differences between Lab Data and Field Data.
Source: Adapted from ContentKing.
As a general rule, you should always prioritize Field Data because it captures what your actual users are experiencing. Additionally, Field Data is what Google uses for its search ranking algorithm!
With that said, don’t just ignore Lab Data when your page passes CWV in the field. Performance optimization is a never-ending process, and Lab Data is extremely valuable to identify further optimization opportunities.
Performance scoring
We will introduce the most reliable tools to measure Core Web Vitals later on, but for now, know that PageSpeed Insights and Lighthouse both provide a Performance Score.
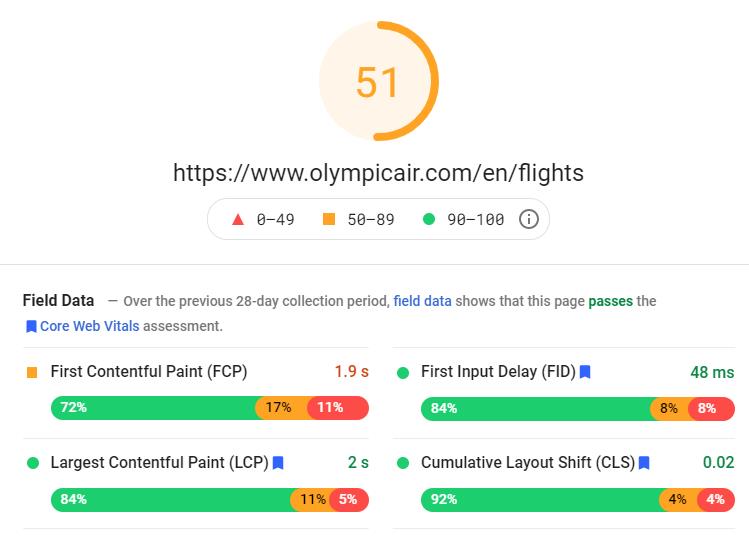
The Performance Score is based on a scale from 1 to 100, and it’s a weighted average of the metric scores. Keep in mind that this score uses Lab Data and the first pageview only.
The Performance Score includes the Core Web Vitals, but it’s not based only on them. Therefore, it does not represent a summary of Core Web Vitals. Six user-centric performance metrics comprise the Performance Score:
- First Contentful Paint (FCP)
- SpeedIndex (SI)
- Largest Contentful Paint (LCP)
- Time to Interactive (TTI)
- Total Blocking Time (TBT)
- Cumulative Layout Shift (CLS)
Each performance metric is weighted differently in the Performance Score.
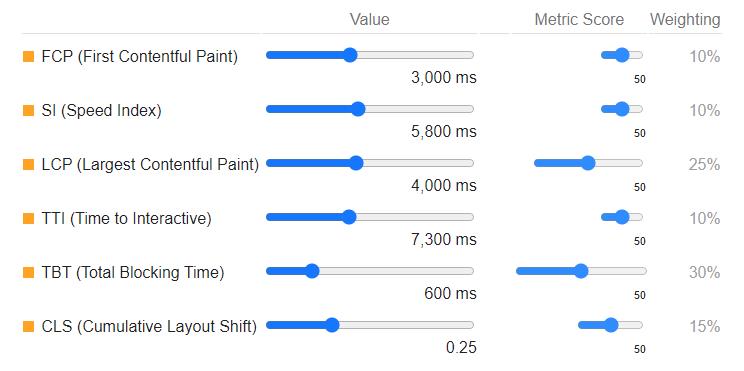
Source: Lighthouse Scoring Calculator.
Check out the Scoring Calculator to see how Lighthouse weights each performance metric.
It all means that a green Performance Score does not automatically translate into passing Core Web Vitals. The opposite is also true. For example, as the screenshot above shows, a page can simultaneously pass Core Web Vitals and get a low Performance Score.
That’s why Google has said that Performance Score does not affect Google search.
Finally, you should also consider that several internal and external factors can cause variability in Performance Scores.
Tools to measure Core Web Vitals
Google provides several tools to monitor your site’s Core Web Vitals, including:
- Google Search Console
- PageSpeed Insights
- Lighthouse
- Chrome DevTools
- Chrome UX Report
- Web Vitals Extension
However, not all Core Web Vitals are available to test with each tool.
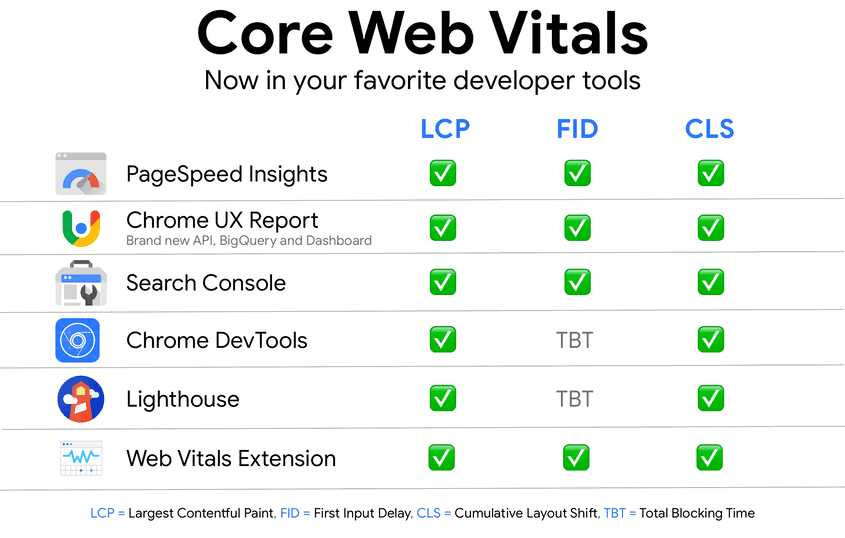
Source: Google.
As we cover the workflow to audit Core Web Vitals, you will learn the basics of using each tool for measuring and troubleshooting.
