Optimize Page Speed
SEO for Airlines
Site speed has always been an obsession for conversion-focused websites. That’s because 53% of mobile users leave a site that takes longer than three seconds to load! There are also plenty of case studies that demonstrate why performance matters for conversions.
Site speed may also have implications for a site’s performance in organic search. In July 2018, Google announced that page speed would become a ranking factor in what’s officially known as Google Speed Update.
Here are the key highlights of the Speed Update:
- It affects pages that deliver the slowest experience to users.
- It applies the same standard to all pages, regardless of the technology used to build the page.
- It is based on user experience metrics rather than relying entirely on “static” metrics like TTFB, DOMContentLoaded event, Onload event, Fully Loaded event, etc.
However, although the faster the better, there is a threshold, a limit below which a faster page doesn’t get any SEO benefit. The Speed Update only affects the slowest sites, meaning that saving a few microseconds off of an already fast page will not lead to a ranking improvement. Therefore, the site does not need a perfect score.
In fact, according to Googlers, page speed is a “tiny” ranking factor:
Ranking wise it's a teeny tiny factor, very similar to https ranking boost. That particular one is not surprising. You do that primarily to enable users to convert.
— Gary 鯨理/경리 Illyes (@methode) April 28, 2020
Page speed might not be that important for SEO, as long as your pages load relatively fast compared to the top organic pages. This is not at all meant to say that you shouldn’t prioritize page speed. After all, a slow page can be an outstanding conversion killer.
In this section:
1. Focus on user experience metrics >
1. Focus on user experience metrics
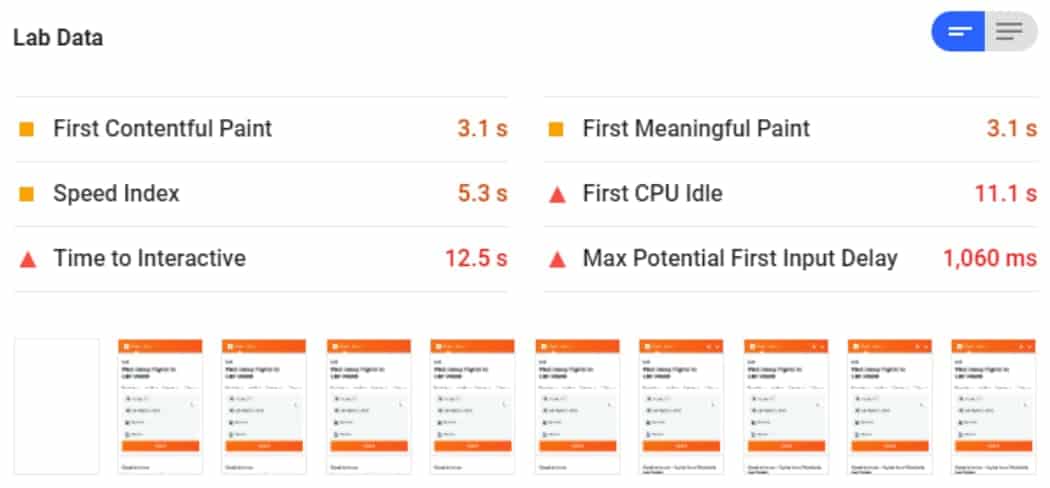
The user experience metrics are used by Google to measure a page performance as perceived by a human. To understand when a page delivers this feedback to its users, Google defined the below metrics:

Below there is a more specific description for each user experience metric:
- First Contentful Paint : marks the time at which the first text or image is painted.
- First Meaningful Paint: measures when the primary content of a page is visible.
- Speed Index: shows how quickly the contents of a page are visibly populated.
- Time to Interactive: is the amount of time it takes for the page to become fully interactive. Learn more.
- First CPU Idle: marks the first time at which the page’s main thread is quiet enough to handle input. Learn more.
- Max Potential First Input Delay: the maximum potential First Input Delay that your users could experience is the duration, in milliseconds, of the longest task.
Besides these metrics, Google recently announced essential metrics for a healthy site as part of the Web Vitals project. Google says that there are three important metrics when it comes to providing great user experience:
- Largest Contentful Paint (LCP): measures loading performance. To provide a good user experience, LCP should occur within 2.5 seconds of when the page first starts loading.
- First Input Delay (FID): measures interactivity. To provide a good user experience, pages should have a FID of less than 100 milliseconds.
- Cumulative Layout Shift (CLS): measures visual stability. To provide a good user experience, pages should maintain a CLS of less than 0.1.
You can measure the user experience metrics with Lighthouse and Google PageSpeed Insights. Lighthouse is primarily for your local iteration as you build your site while PageSpeed Insights provides a snapshot of improvement opportunities. However, the recently announced Web Vitals metrics are not yet available to test with Lighthouse or Google PageSpeed Insights.
Additionally, there are many more site speed tools that you can check on Google’s performance tooling page. This is because a single metric, user or tool can’t capture the representative user experience on a site.
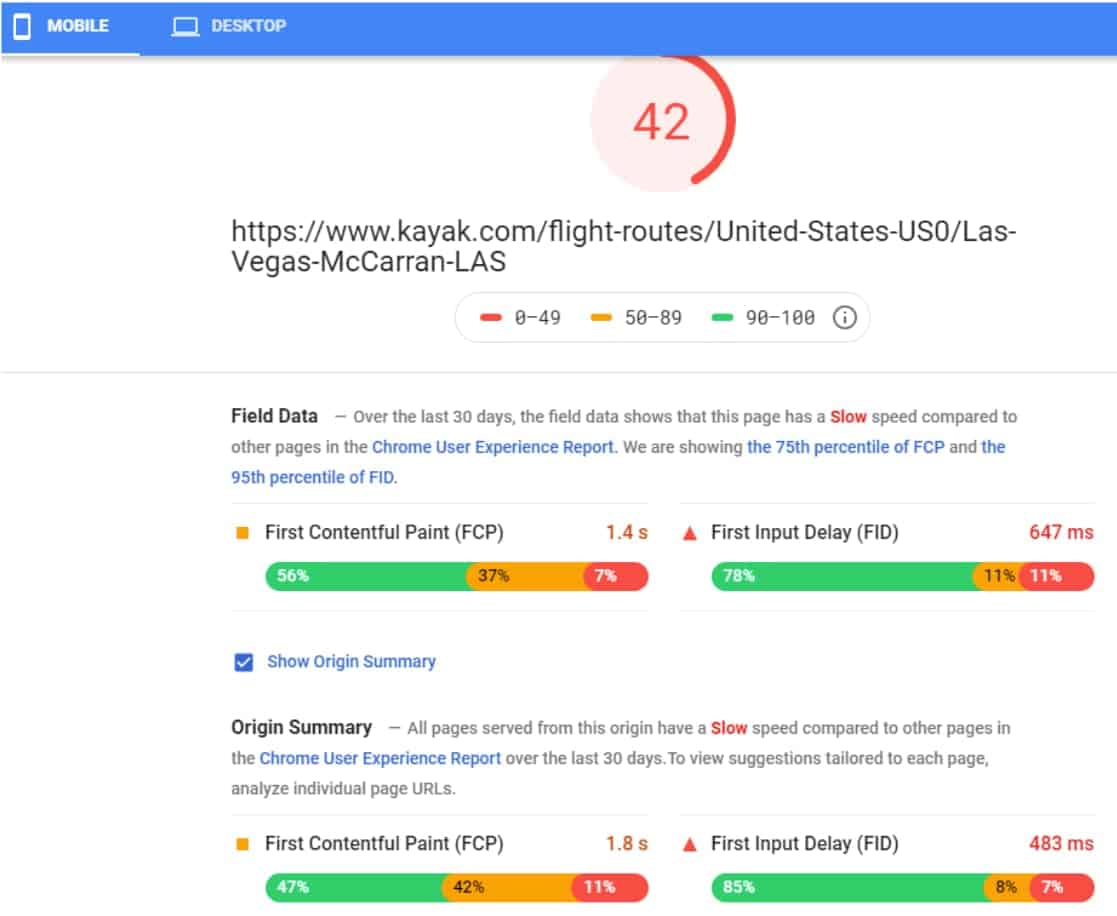
The Google PageSpeed Insights tool is one of the most used for speed optimization because it provides field data, lab data, and an overview of optimization opportunities to improve user experience metrics. It provides two reports, one for Mobile and another for Desktop devices. In both reports, you will find:
Performance score: it summarizes the page performance. A score of 90 or above is considered fast, and 50 to 90 is considered moderate. Below 50 is considered to be slow.
Field data: it includes the historical performance of a URL and represents anonymized data from users in the real-world on a variety of devices and network conditions. It captures the real-world experience from the Chrome User Experience Report, but it has limited debugging capabilities.
Origin summary: it includes an overage of the field data for the whole site.

Lab Data: Includes performance data collected within a controlled environment with a predefined device and network settings. It is helpful for debugging issues, but it may not represent real-world experience.

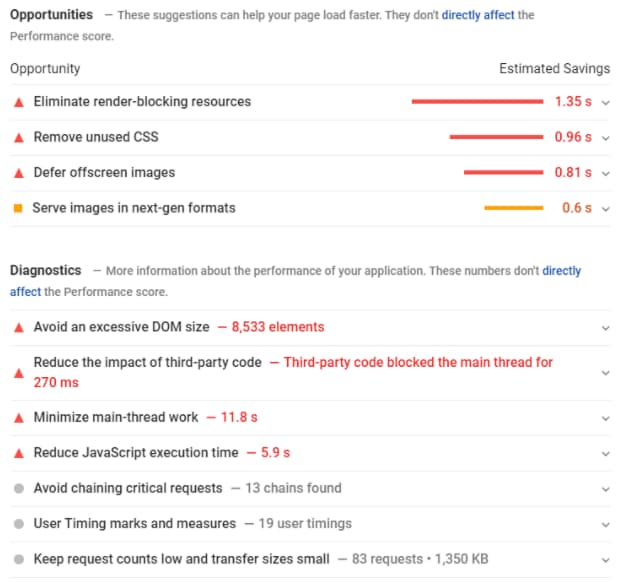
Opportunities: it includes suggestions to improve the page’s performance metrics.
Diagnostics: it provides additional information on how a page adheres to best practices for web development.
Passed audits: it indicates the audits that have been passed by the page.

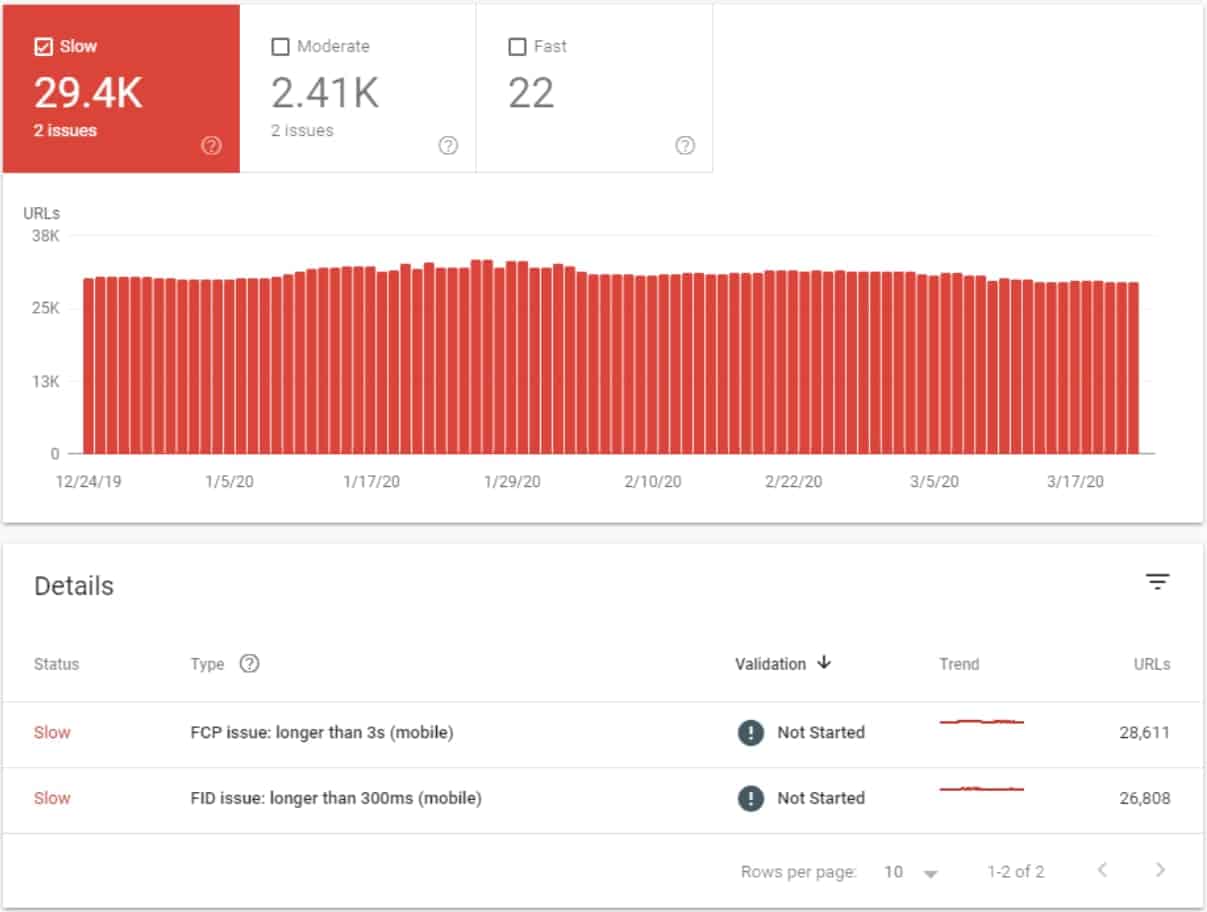
You can also monitor the site’s speed performance in the Google Search Console Speed report. The report shows performance grouped by speed status, metric type, and similar URL type. The report is based on two metrics: FCP and FID. It provides field data from the Chrome User Experience Report.

The page speed is evaluated against the below metrics:

2. Implement the common fixes first
There is a vast array of techniques to optimize the loading and rendering performance of a page. We recommend the airline’s IT or Development team look into all the potential speed optimization opportunities.
You can also start with the priority issues detected by the tools outlined above or with the most common fixes to optimize page speed:
- Reduce server response times
- Avoid redirect chains
- Minify and compress CSS and JavaScript
- Defer unused CSS
- Resize and compress images.
- Serve images in next-gen formats
- Enable text compression
- Preload key requests
- Avoid enormous network payloads
- Defer off-screen images
- Eliminate render-blocking resources
- Pre-connect to required origins
- Ensure text remains visible during web-font load
- Minimize main-thread work
- Reduce JavaScript execution time
- Serve static assets with an efficient cache policy
- Avoid an excessive DOM size
- Minimize Critical Requests Depth
- Optimize API responses
- Lazy-load unused dependencies
- Avoid extra DNS lookups
- Use a CDN
To dive into how to do all this stuff, check out Google’s documentation and this great guide from Link Assistant.
